
Local consumer search behavior trends in Q2 2026

Each quarter, we analyze Google Business Profile performance data across enterprise brand locations in six industries to show how local search behavior is shifting. This quarter’s local consumer search benahvior trends data covers 205,188 locations.
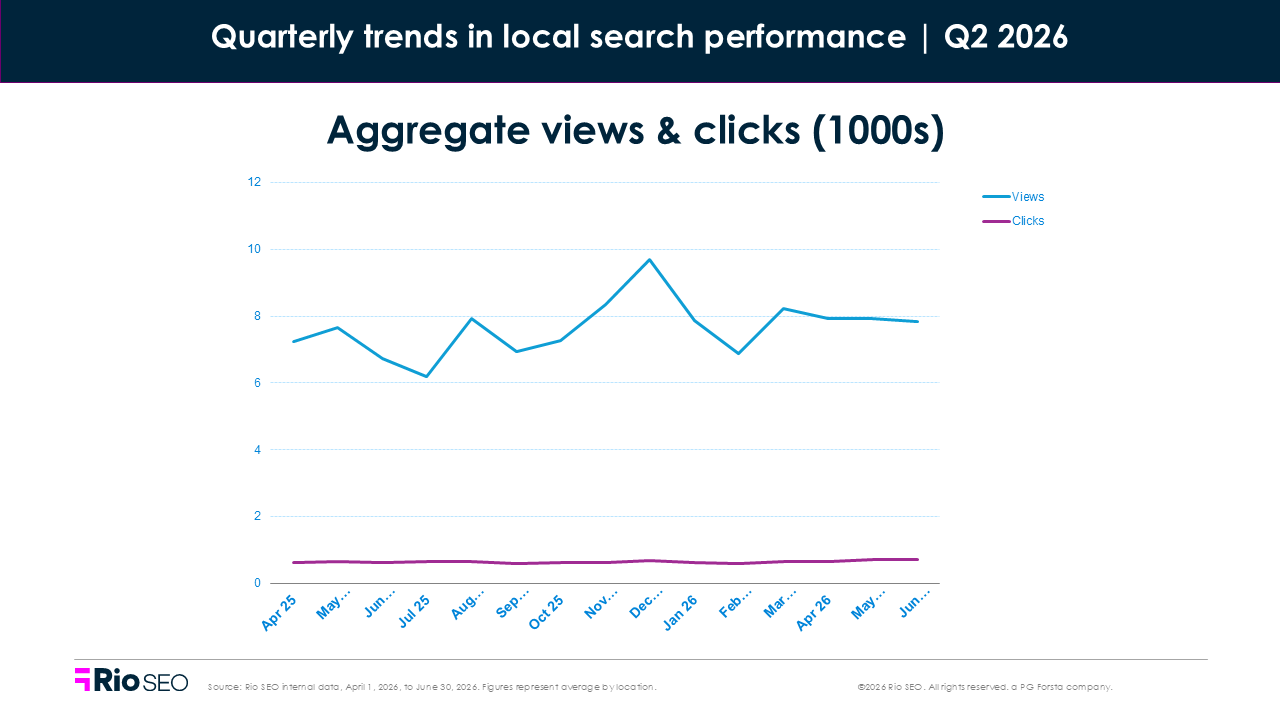
The clearest shift this quarter was the widening gap between visibility and action. Maps gained ground on Search year over year, while clicks grew faster than views overall. And phone clicks, for decades the way customers made first contact with a local business, moved slower than anything else we measure.
These shifts have been building for some time, but they became more evident than ever before this quarter. Google has spent years answering routine questions right on the results page, and AI Mode now handles a wider range of queries without requiring someone to visit a brand’s listing. Changes like these may be contributing pressure on traditional Search visibility, while Maps continues to play a crucial role in local discovery.
It wasn’t the same story across the board, though. Some industries saw clicks rise sharply while others lost ground, and conversion actions varied by category. Here’s where local search behavior shifted this quarter, industry by industry, and what to do about it.
The story behind the numbers
Between June 24 and July 17, 2025, a confirmed Google reporting glitch suppressed search impressions across Google Business Profile performance data. Engagement held steady throughout, and impressions recovered from mid-July.
About six days of that window fall inside Q2 2025, the year-over-year (YoY) comparison base this quarter is measured against. A lower base makes growth look bigger, so the YoY view figures overstate the gain slightly. Click figures are unaffected.
Two Google core updates also landed in the quarter. The March update finished rolling out on April 8, and the May update ran from May 21 to June 2. Ranking volatility sits beneath every visibility metric here and should be kept in mind when reviewing the following results.
Year-over-year local search trends
- Total Views: +9.6%
- Total Clicks: +10.7%
By type:
- Maps Views: +16.4%
- Search Views: +4.5%
- Clicks – Phone: +0.6%
- Clicks – Website: +10.8%
- Clicks – Driving Directions: +8.8%
From April through June, Maps views grew 16.4% YoY against 4.5% for Search views, a pattern that repeated in four of the six industries we track. Clicks outpaced views against Q2 2025, up 10.7% to 9.6%. Phone was the slowest-moving action with 0.6% growth.
Quarter-over-quarter local search trends
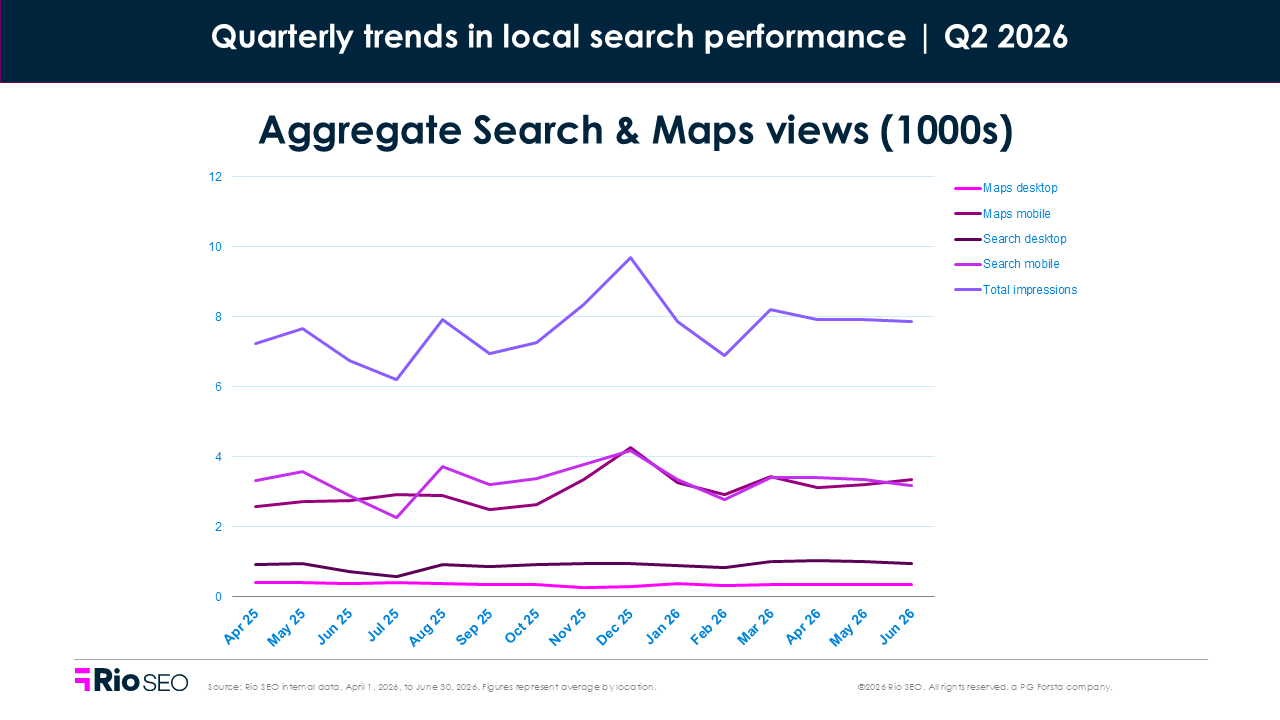
- Total Views: +3.1%
- Total Clicks: +11.7%
By type:
- Maps Views: +0.7%
- Search Views: +5.2%
- Clicks – Phone: +5.1%
- Clicks – Website: +15.8%
- Clicks – Driving Directions: +10.3%
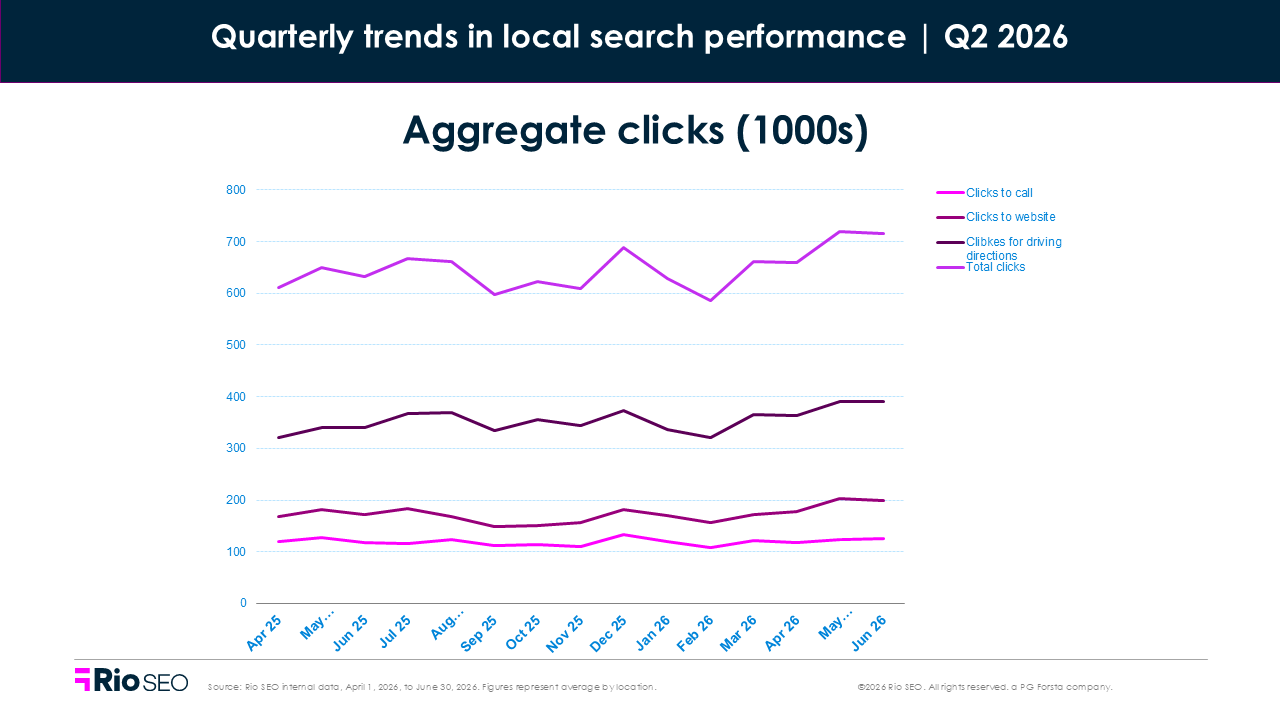
Quarter over quarter, Search views grew 5.2% while Maps was nearly flat at 0.7%. People are doing more once they land on a listing: views grew 3.1% while actions on those listings grew 11.7%, led by website clicks at 15.8%. The same traffic is producing more calls, clicks and directions requests than it did three months ago.
Retail
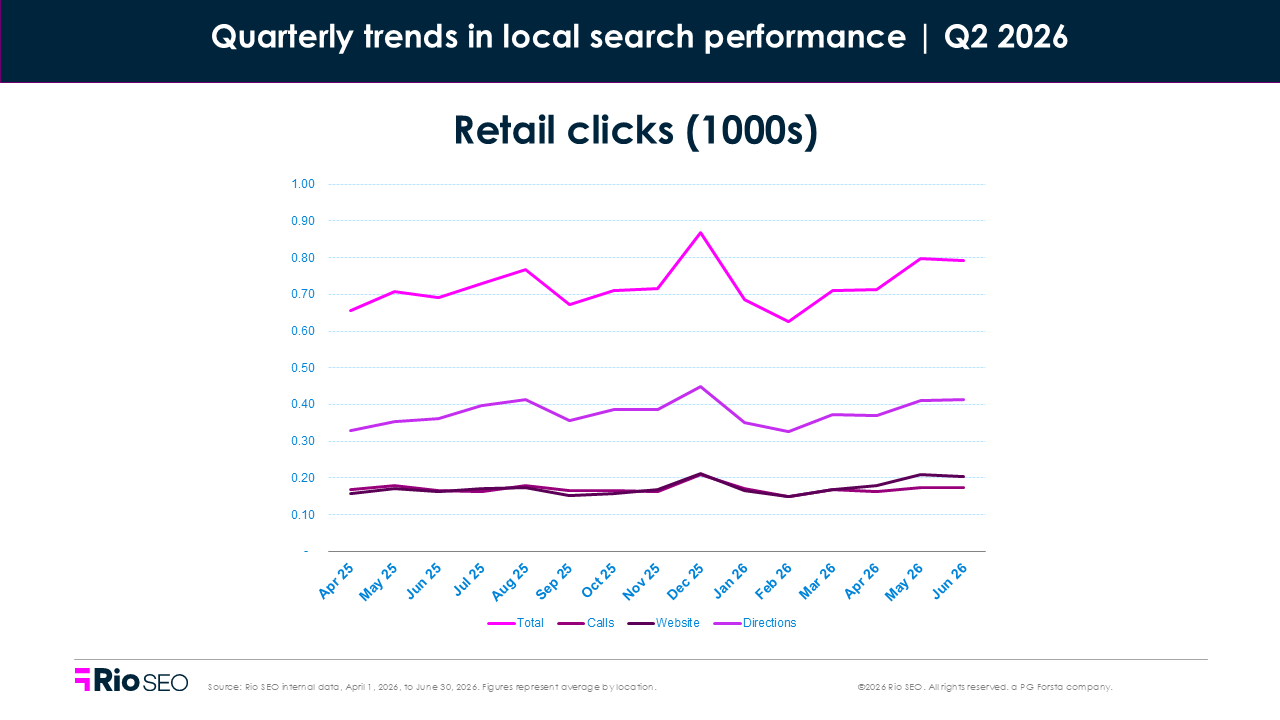
- Total Q2 2026 views: +7.7% QoQ, +15.7% YoY
- Total Q2 2026 clicks: +13.7% QoQ, +11.9% YoY
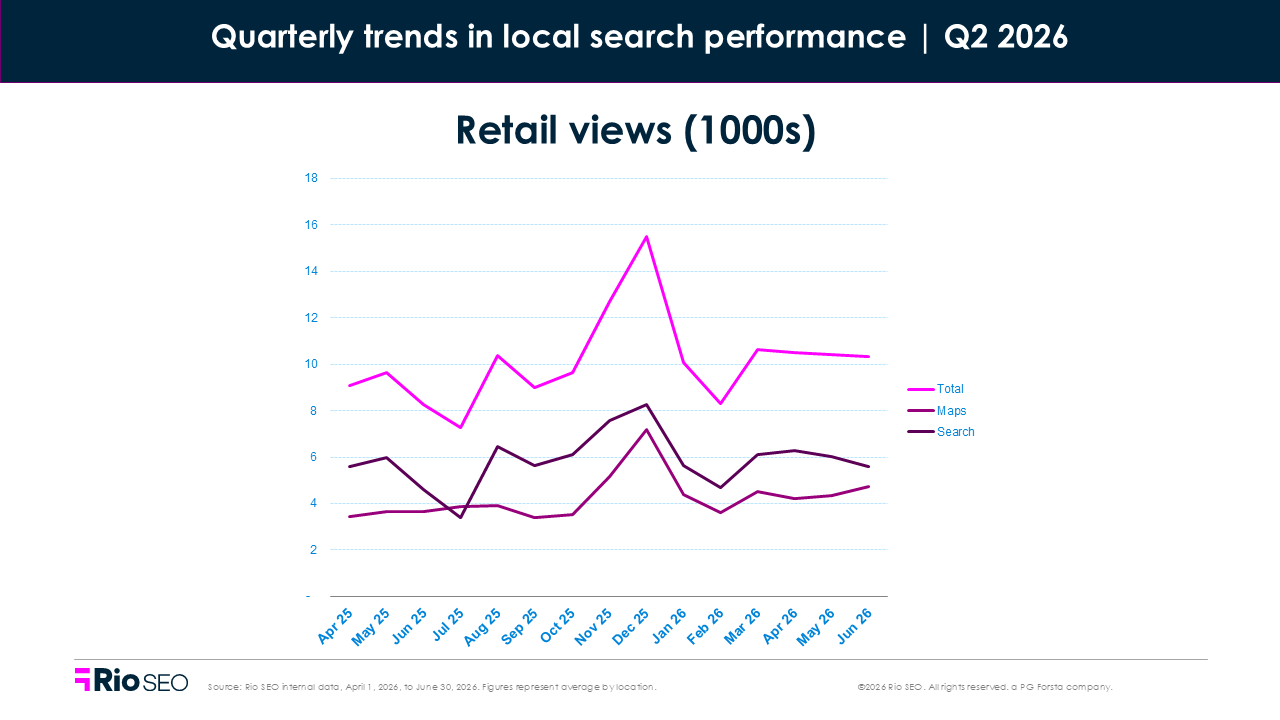
Retail was the strongest performer of any established industry this quarter. Maps views grew 23.4% against Q2 2025, more than double Search’s 10.7%. Website clicks rose 20.4% and driving directions 14.2%. Phone clicks were the exception, flat at -0.8%. If your Maps growth outpaced Search by roughly that margin, you’re in line with the industry.
That gap is the thing to plan around. Shoppers who open Maps have usually chosen where they’re going, and what they do next depends entirely on what your listing tells them. The store with the local page that loads, a pin that’s right, and listing hours that match the ones on the door wins the foot traffic.
Where to focus next
- Point Maps actions at accurate store data. Driving directions grew 14.2%, and every one of those is someone heading to a physical door. A wrong pin, stale hours or a missed holiday closure turns into a wasted trip.
- Land the website click locally. Website clicks were the fastest-growing action at 20.4%. If that click lands on a homepage instead of the store’s own page, the highest-growth action in the industry ends on a search box.
Financial services
- Total Q2 2026 views: -0.8% QoQ, -5.9% YoY
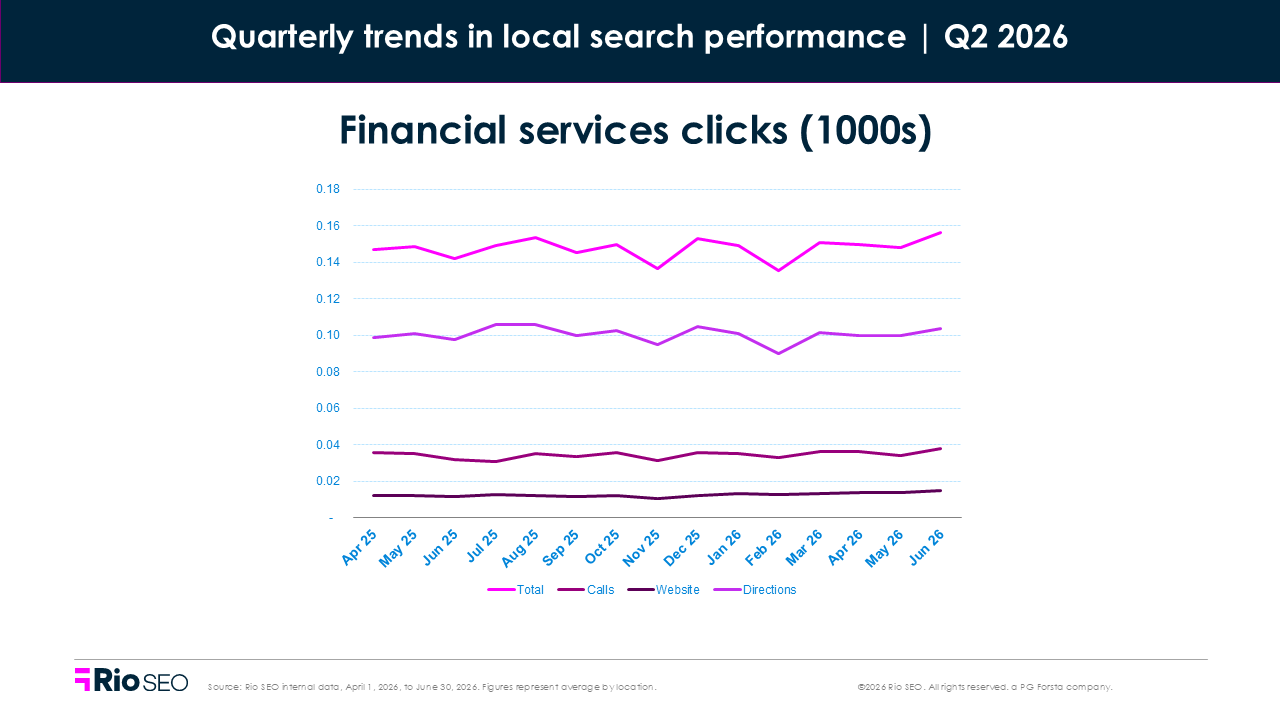
- Total Q2 2026 clicks: +4.3% QoQ, +3.8% YoY
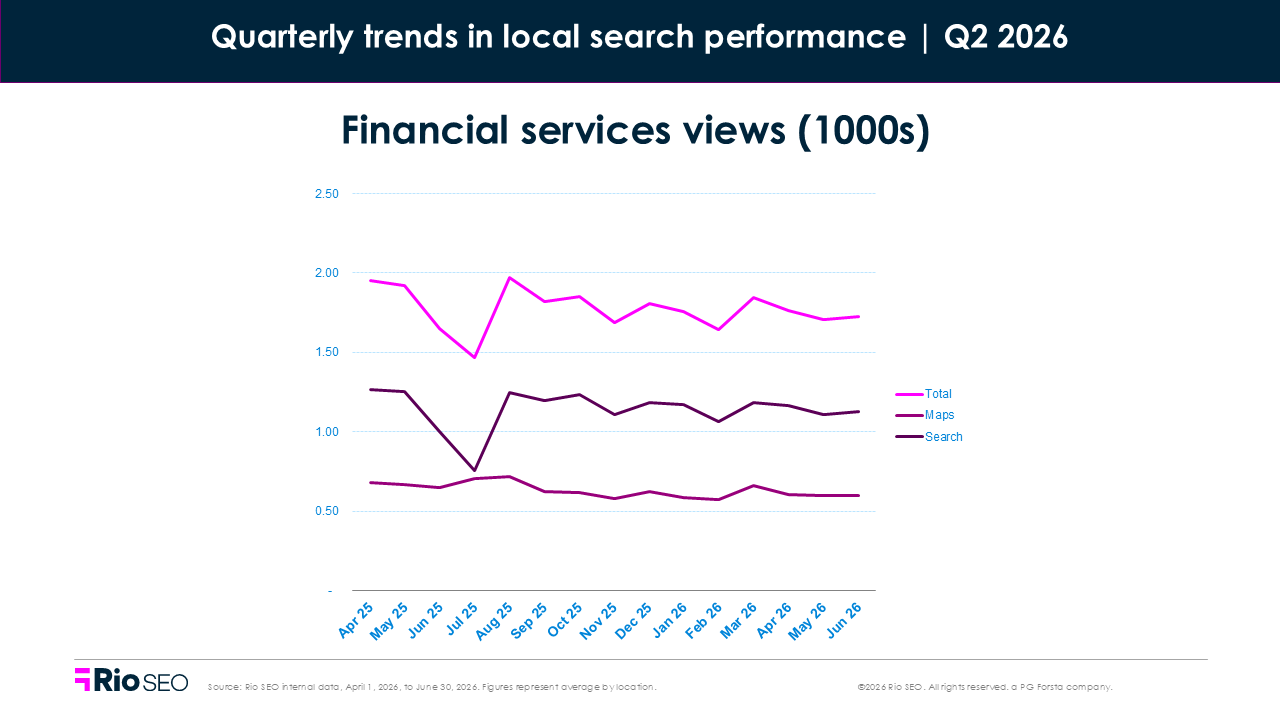
Every conversion action rose while views fell. Against Q2 2025, Maps views were down 9.7% and Search views down 3.7%. Website clicks led at +15.7%, with phone up 4.8% and driving directions up 2.0%. Fewer people reached these listings, and more of the ones who did took action. Falling views alongside rising clicks is the industry pattern this quarter, not necessarily a brand-level problem.
Which queries still reach a listing at all seems to be changing. Branch hours, locations and phone numbers are exactly the questions AI surfaces now answer outright, and AI Mode passed one billion monthly users this year. When Google answers the question on the results page, customers may have less reason to visit the listing at all.
Where to focus next
- Watch what happens after someone arrives. A dashboard tracking impressions alone reads this quarter as a decline. The growth only shows up when you measure the actions people took on the listing.
- Keep branch, office, and ATM details current everywhere. Hours, services and contact details now feed answers that appear before anyone reaches the listing, so a stale record surfaces as a wrong answer with no click for a customer to correct.
Service businesses
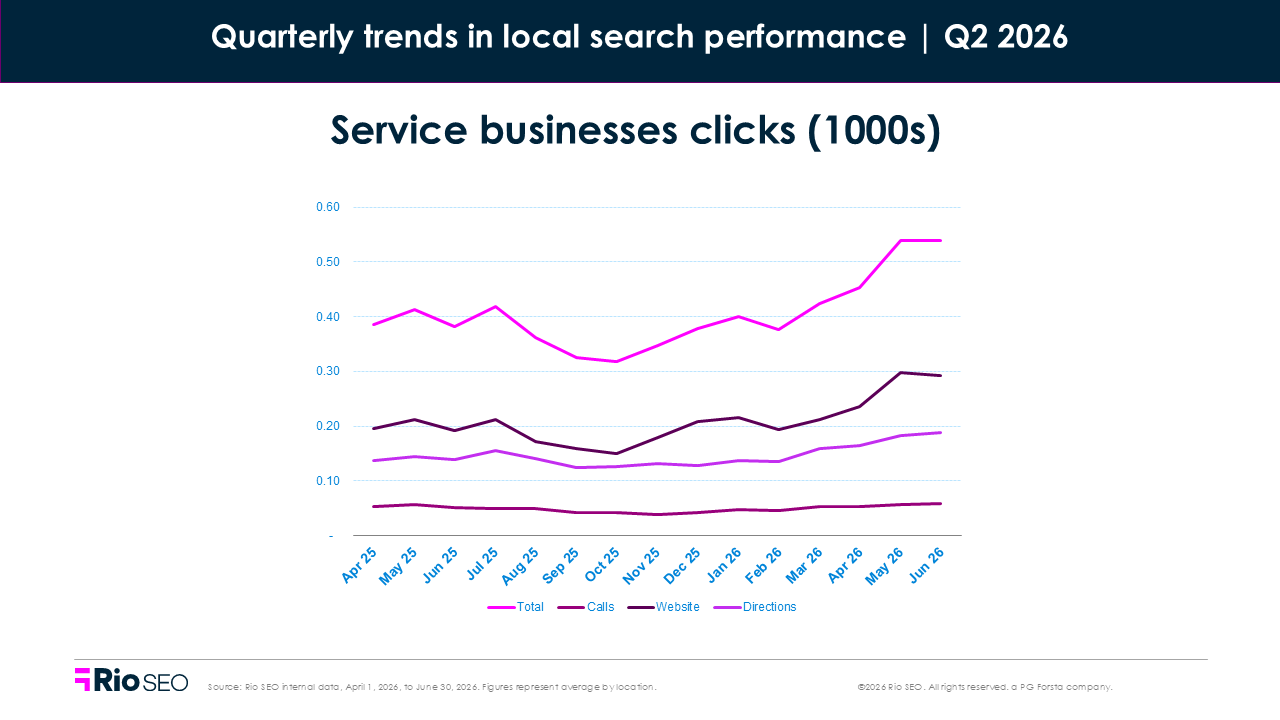
- Total Q2 2026 views: +12.9% QoQ, +15.0% YoY
- Total Q2 2026 clicks: +27.4% QoQ, +29.7% YoY
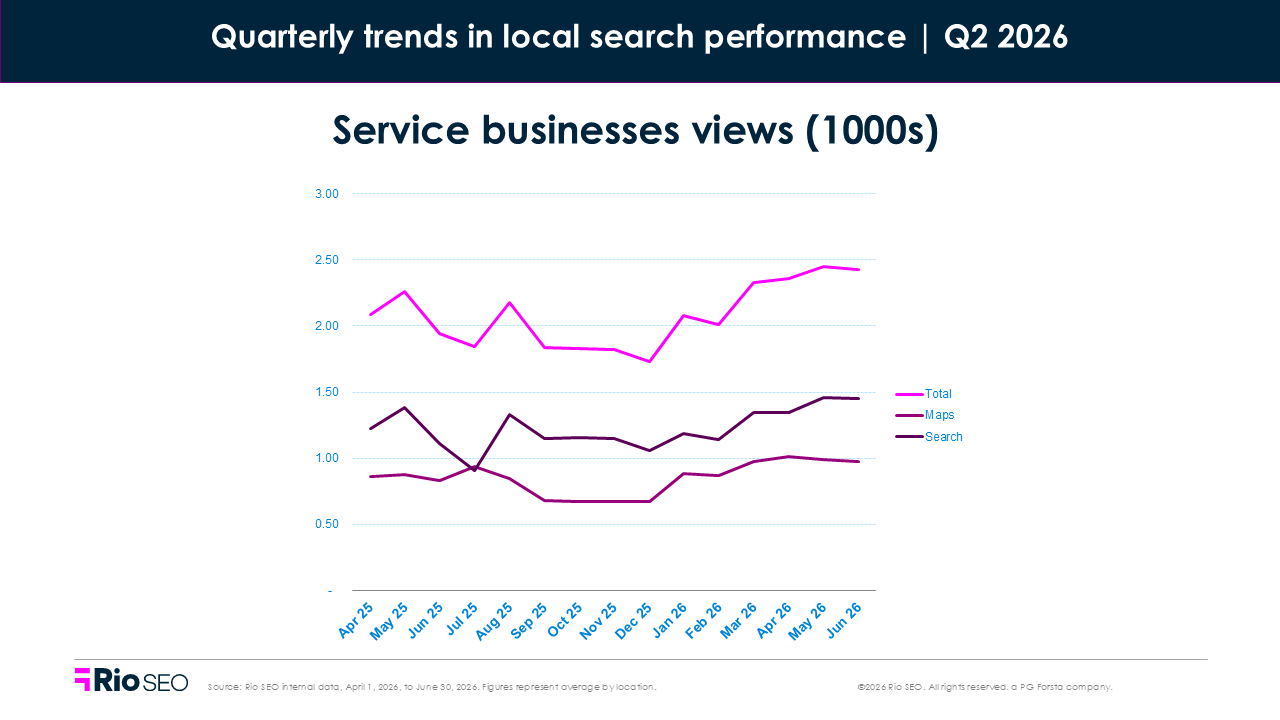
Website clicks led every action we tracked, up 37.6% year over year. Driving directions followed at +27.5%. Maps views (+15.7%) and search views (+14.6%) grew at roughly half that rate, so the people finding these listings acted on them more often than they did a year ago. Phone clicks moved the least, up 5.5%.
That order tracks an interface change. Google has been swapping call buttons for images in several industries, and its new AI local packs carry no call button at all. Sterling Sky’s 2026 local search analysis found clicks-to-call declining across two years of Google Business Profile data while website clicks held steady. So a call number that grew this slowly likely reflects the layout rather than demand.
Where to focus next
- Audit the actions Google still surfaces. Website clicks and directions resolve straight from listing data, so a location pointed at a homepage, or a pin on the wrong side of the street, costs more than it did a year ago.
- Shorten the path to a booked job. Google is expanding agentic booking to local services, including calling businesses on a searcher’s behalf for home repair, beauty and pet care in the US this summer.
Healthcare
- Total Q2 2026 views: -2.4% QoQ, +1.4% YoY
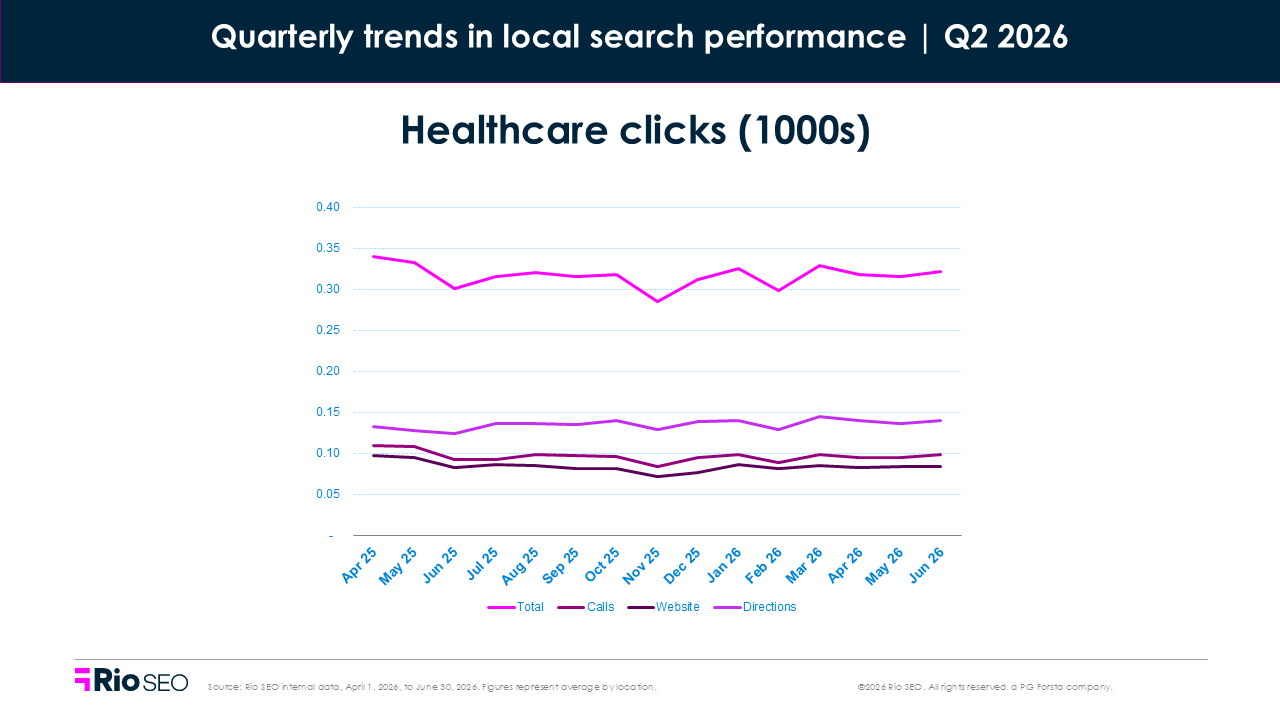
- Total Q2 2026 clicks: +0.2% QoQ, -1.7% YoY
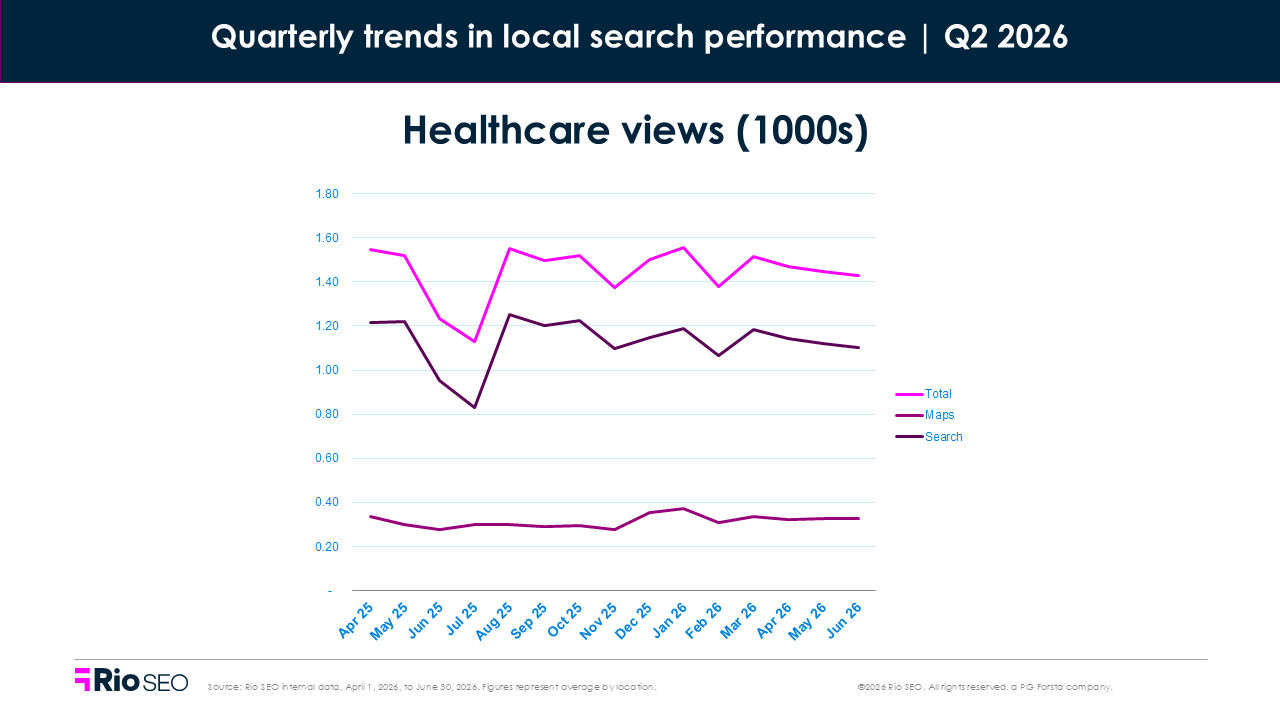
Across the healthcare locations in this report, phone clicks fell 7.1% YoY and website clicks 9.0%, while driving directions grew 7.9% and Maps views 7.2%. Search views were essentially flat at -0.1%. If your own call volume is down by roughly that much, the market moved with you. A steeper drop is worth looking into.
Healthcare was the only industry here where views grew, but clicks didn’t follow. More people reached these listings than a year ago, and fewer of them did anything from there. That doesn’t necessarily mean patients aren’t converting. Scheduling actions may be playing a larger role in how patients engage with healthcare listings, potentially reducing their reliance on traditional actions like call clicks.
Where to focus next
- Make it easy to book from the listing. Phone and website clicks fell 7.1% and 9.0%, and those are the two ways a patient books an appointment without leaving Google. Appointment links, accepted insurance, services offered and current hours all come straight from your listing data.
- Get the arrival details right. Driving directions grew 7.9%, the only action moving up. Suite number, which entrance to use, and department hours decide whether that trip ends at the right desk.
Hospitality
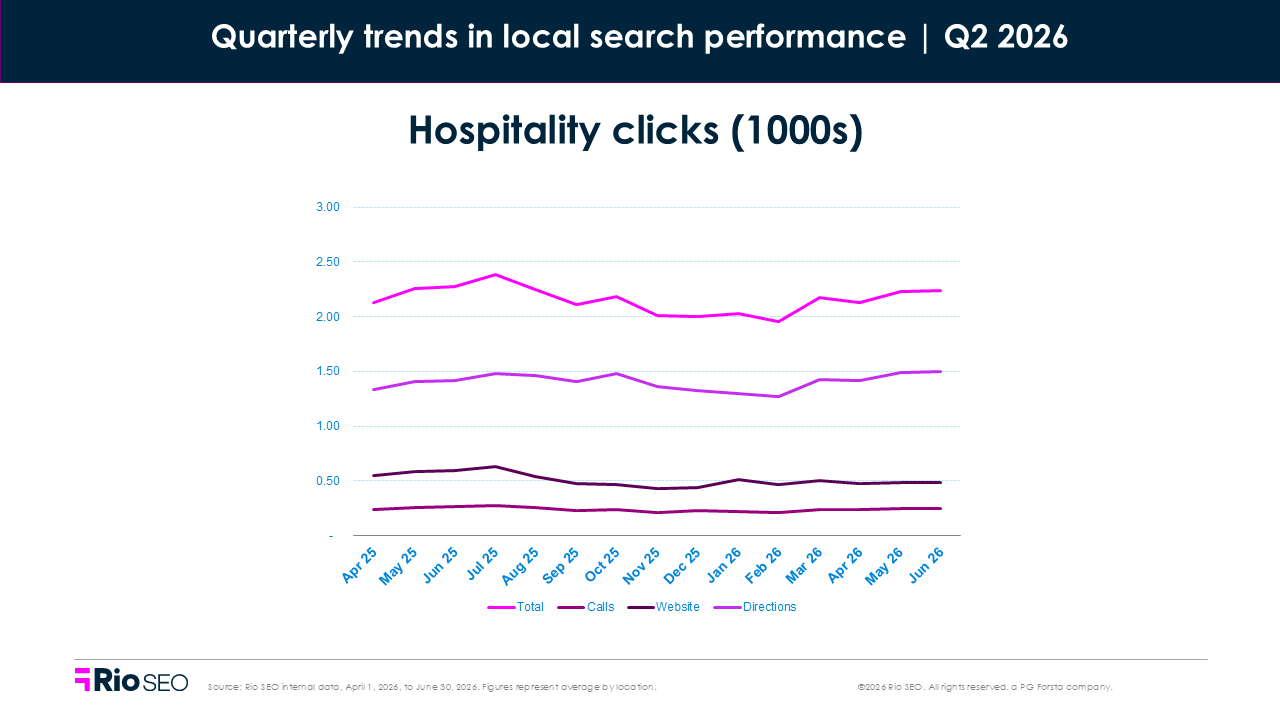
- Total Q2 2026 views: +2.0% QoQ, -14.2% YoY
- Total Q2 2026 clicks: +4.3% QoQ, -5.6% YoY
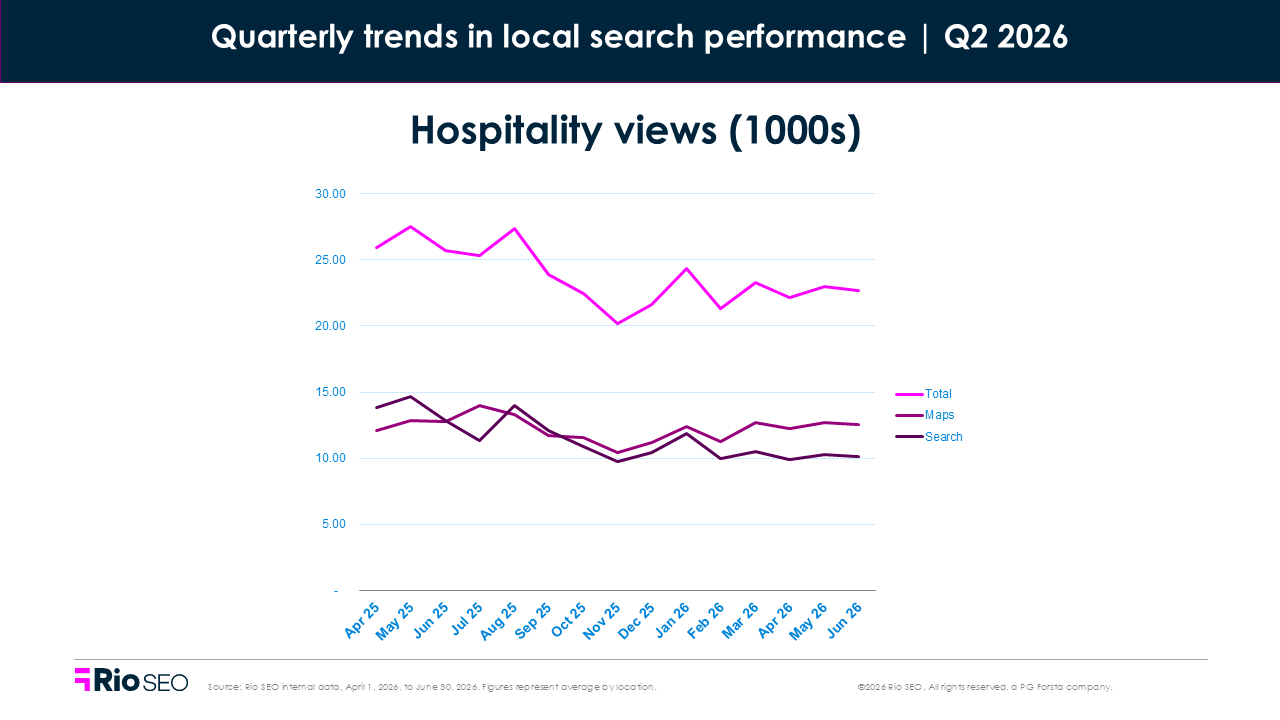
Hospitality brand locations saw Search views fall 26.7% YoY on average, the steepest annual drop anywhere in this quarter’s data. Maps views held nearly flat at -0.5%. Phone clicks fell 12.9%, and website clicks fell 8.2% while driving directions grew 6.5%. If your Search visibility fell sharply while Maps held, you’re seeing the same thing the rest of the industry is.
Hospitality searches are unusually easy for Google to answer without a click. Rates, availability, amenities and check-in times all appear in the result itself, and hotel search has carried booking modules and price comparison longer than any other local category. Maps and directions hold up because people who have already chosen where they’re staying still need to get there.
Where to focus next
- Feed the answer Google builds. Search views fell 26.7%, so what Google shows before the click matters more than it did a year ago. Amenities, policies, photos and current rates are what get a property into that answer.
- Own the details people check on the way. Directions grew 6.5% while every action that doesn’t involve leaving home fell. Entrance, parking and check-in information all sit in your hotel listings, and a guest who can’t find them arrives frustrated or calls the front desk instead.
Restaurants
- Total Q2 2026 views: -10.0% QoQ, +18.0% YoY
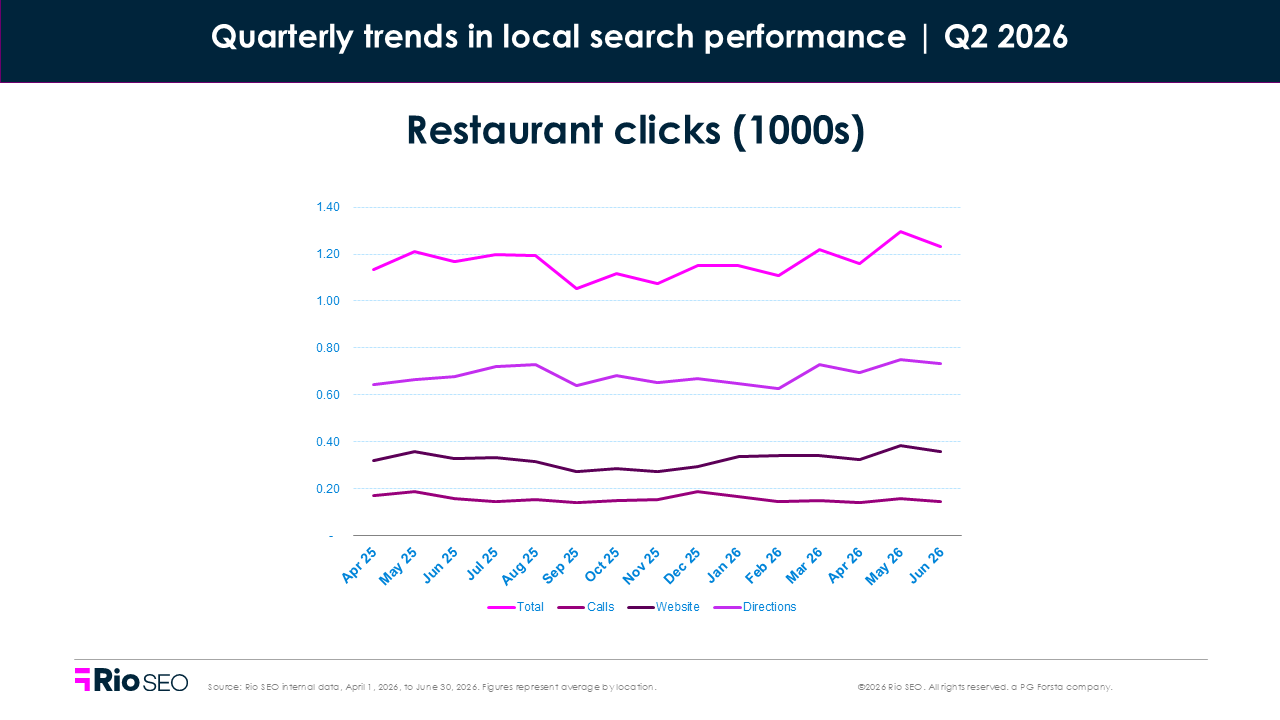
- Total Q2 2026 clicks: +5.9% QoQ, +4.8% YoY
- Food menu clicks per location: +7.3% QoQ, +5.7% YoY
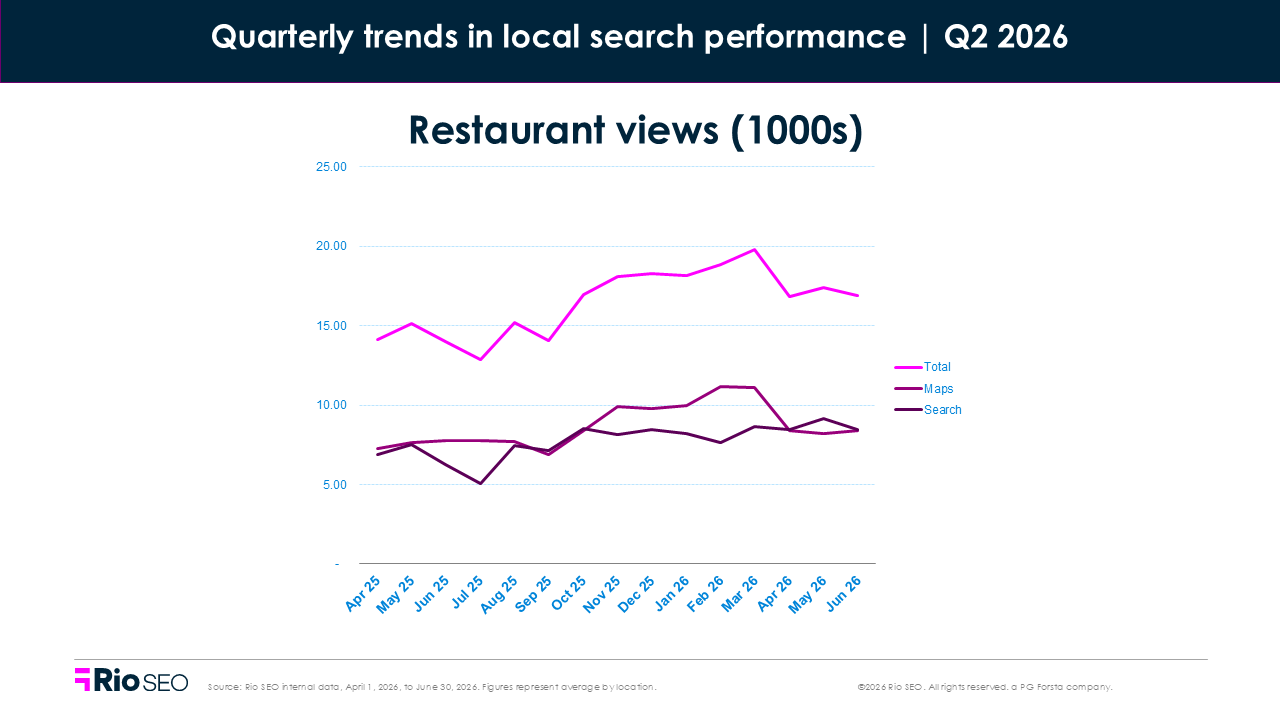
Across the restaurant locations in this report, Search views grew 25.9% YoY against 10.7% for Maps views, the only industry where Search views grew faster than Maps views. Phone clicks fell 14.2% while driving directions grew 9.3%, and menu clicks and website clicks each rose 5.7%. Quarterly views fell 10.0%, giving back part of an unusually strong Q1.
Your menu used to be something people checked after they’d decided where to eat. Now it’s what they use to decide, and a missing price or a dish you stopped serving months ago costs you the visit.
Where to focus next
- Keep the menu current. Menu clicks grew 5.7% while calls fell 14.2%, so more diners are choosing straight from the menu on your listing. Prices, photos, seasonal changes and dietary tags all need to match what you’re actually serving today.
- Check where your order button sends people. Google routes ordering clicks to whichever provider is set as preferred on your profile. If nobody has set one, a diner who meant to order from you can end up on a marketplace instead, paying commission you never agreed to.
What Q2 tells us about local search
Directions grew in every industry we looked at. Calls fell in four of six. The clearest takeaway from Q2 is that the actions people take after finding a business are changing.
None of that is new. What this quarter shows is how much further it’s gone: the phone was the fallback when your listing didn’t answer the question, and diners, patients and shoppers are using it less.
Wrong hours, a practitioner that moved locations, or a discontinued amenity may seem like small things at the location level. Across a thousand locations, they’re a revenue line that compounds, because nobody files a complaint about the location they decided not to visit.
Want to know where you stand? Request your free local audit to uncover hidden gaps, growth opportunities, and tips tailored to your brand.
Related resources

Leading mobility company turns reputation management into a powerful acquisition and revenue driver

evo: Turning reputation into a growth engine
Solotel: Using guest feedback to drive visibility, engagement, and better decisions
Newsletter
Get industry insights that matter, delivered direct to your inbox
We collect this information to send you free content, offers, and product updates. Visit our recently updated privacy policy for details on how we protect and manage your submitted data.