Local consumer search behavior trends in Q3 2025

For years, local search success meant one thing: rank high in search results and earn the coveted click.
Today, search has evolved—and so have the opportunities. AI-driven engines are changing what visibility looks like, creating new ways for customers to discover and connect with brands. Between AI summaries, map packs, design tweaks, and ongoing core updates, Google continues to raise the bar on what it takes to stand out.
In short: visibility isn’t vanishing. It’s transforming, as evidenced in local search behavior trends in Q3 2025 analysis.
The story behind the numbers
In mid-2025, a 23-day Google reporting glitch disrupted visibility data across nearly every industry. From June 24 to July 17, impressions appeared to plummet—temporarily skewing June and July year-over-year (YoY) and month-over-month (MoM) metrics.
Beyond the anomaly, however, a more meaningful trend emerged: brands are adapting faster to an increasingly volatile, AI-driven search landscape.
As Google experiments with new layouts and call-to-action (CTA) formats, user engagement patterns are shifting. Some listings now show fewer—or entirely different—buttons, altering how users take action. Despite these interface changes, direction requests have remained steady, signaling continued high-intent engagement in moments that matter most.
Customers haven’t disappeared. They’re just finding you differently.
Each quarter, Rio SEO analyzes Google Business Profile (GBP) performance across eight industries and over 180,000 business locations to help brands benchmark performance, identify shifts, and prioritize next steps. Because showing up isn’t the goal anymore; showing up ready to convert is.
Use our analysis to benchmark your results, spot emerging patterns, and guide smarter optimization in the months ahead.
Year-over-year local search trends
Q3 2025 visibility took a dive, and not just because of market shifts. Between June 24 and July 17, that Google reporting issue impacted search views across all clients. Search-heavy industries like retail and staffing saw the biggest drops. And that’s just one layer of disruption.
Since July, Google has also rolled out multiple algorithm updates and UI tests, including mobile button changes that impact how easily users can call or click through from listings. Some users now see only a single action button — or none at all — unless they tap into the full profile.
All of that shows up in the numbers:
- Retail views dropped –12.2% YoY, despite a +4.3% gain in clicks
- Restaurants saw –36.3% fewer views and –6.7% fewer clicks
- Financial services dropped –24.9% in views and -5.2% in clicks
- Business services also took a big hit in visibility (–23%)
The message is clear: impressions are unreliable. Actions tell the real story. Clicks, calls, and direction requests remain strong across most verticals. The data points to one trend with teeth: as listings get less visible, the ones that convert rise to the top.
Healthcare continues to grow YoY in both visibility (+0.6%) and engagement (+6.6%). And multi-family residential saw a lift in views (+14.5%) but a decline in clicks (–9.2%), suggesting more exposure but weaker follow-through.
If you’re tracking visibility alone, you’re missing the bigger picture: intent-driven actions are what define local success now.
Quarter-over-quarter local search trends
Zooming in on Q3 performance, most verticals weathered the reporting disruption with steady or improved engagement, despite lower visibility.
- Retail: Views down –3.8%, but clicks up +3.0%
- Hospitality: Views fell slightly by -3.4%, while clicks rose +1.1%
- Restaurants: Views fell by –10.1% and clicks fell by -3.7%
- Multi-family: Views were up +4.1%%, clicks were down slightly -5.9%
- Service businesses: Small drop in views (–1.4%), big jump in clicks +7.2%
- Healthcare: Flat nearly across the board, a signal of stability, while clicks grew by 6.6%
- Financial services: Views dropped –5.1%, clicks rose +2.1%
The reporting issue complicates visibility comparisons, but the broader pattern is clear: industries leaning into conversion-focused listings and high-intent CTAs are outperforming.
In 2025, your local listing has to do more with less: less real estate, fewer buttons, and fewer chances to make an impression. The payoff for optimizing for action is clearer than ever.
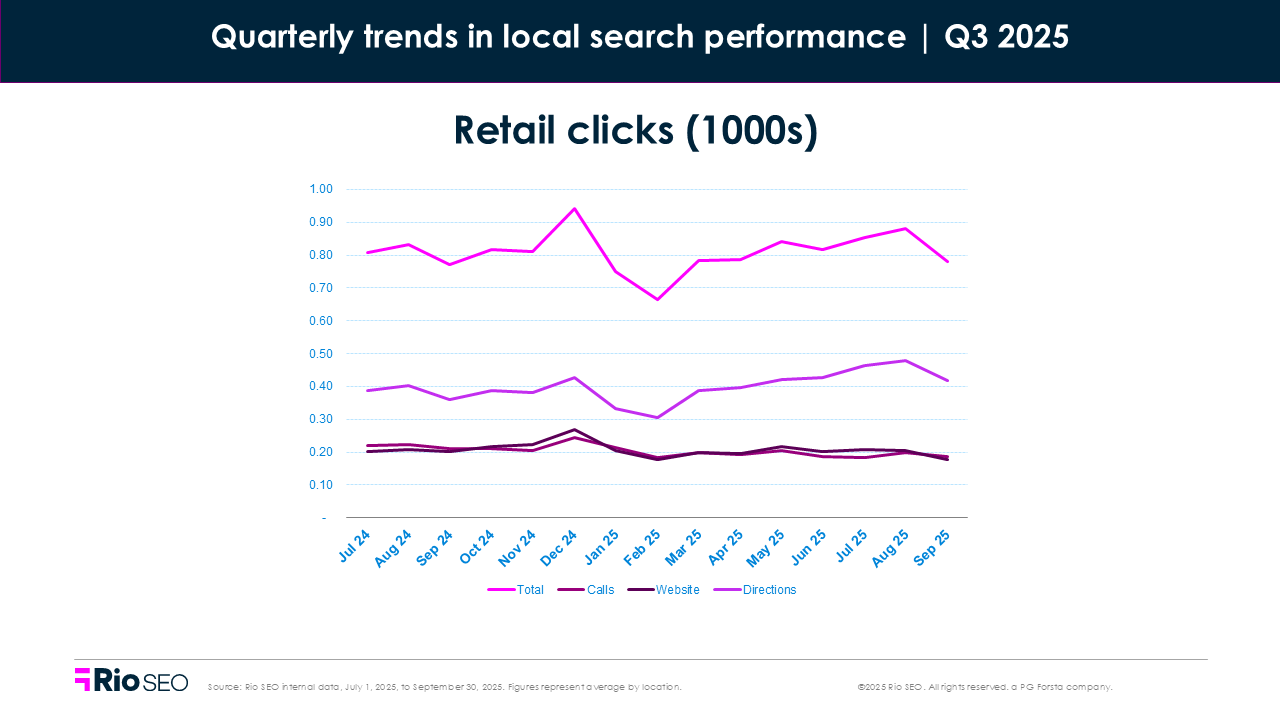
Retail
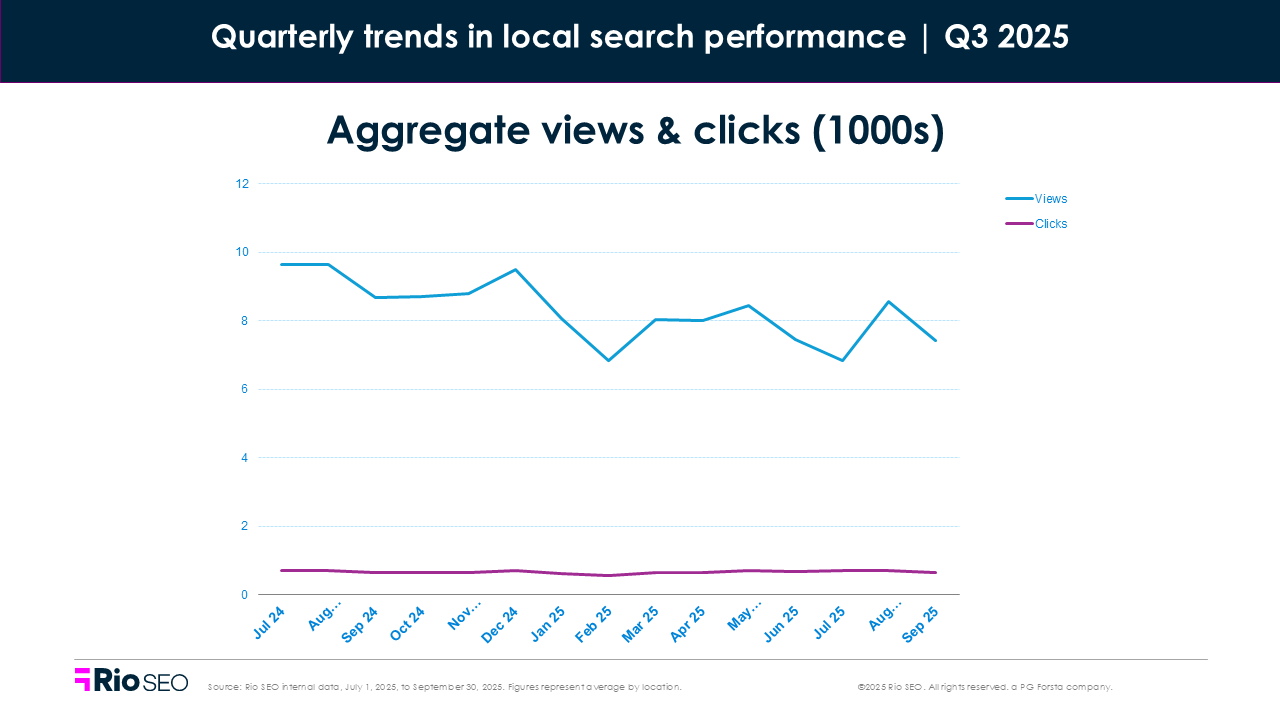
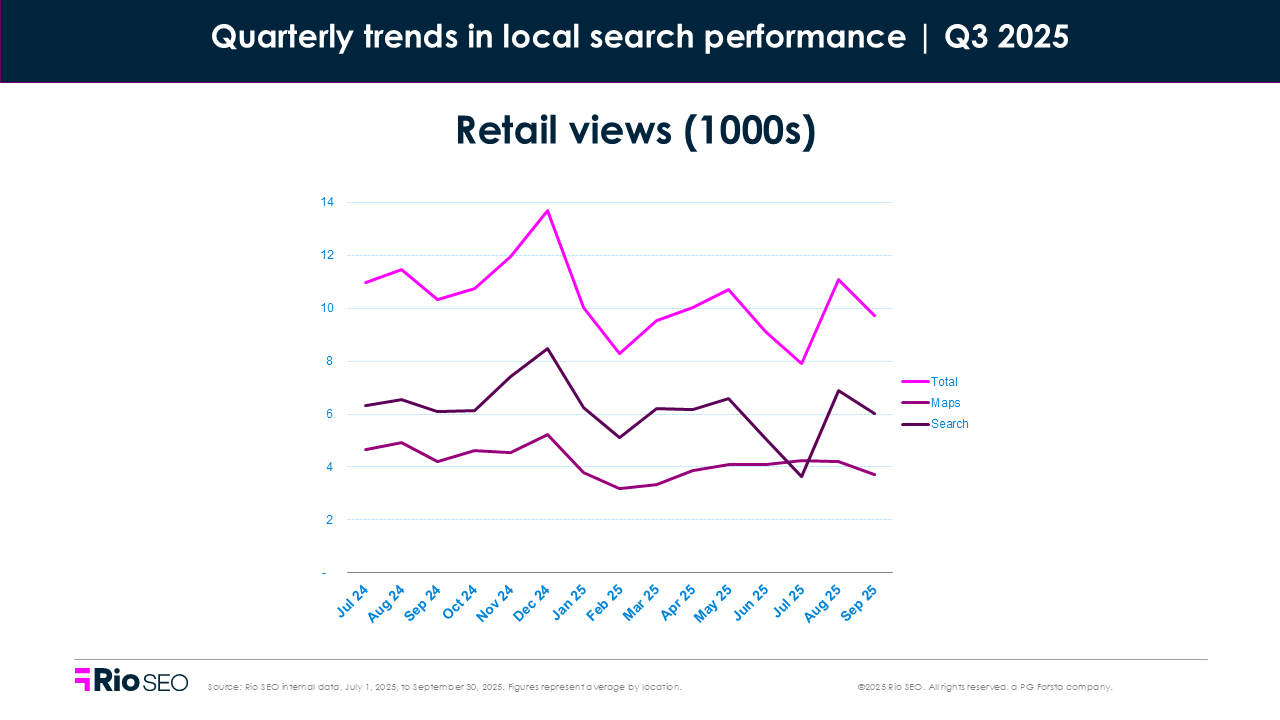
- Total Q3 2025 views: –3.8% QoQ, –12.2% YoY
- Total Q3 2025 clicks: +3.0% QoQ, +4.3% YoY
Retail faced another quarter of declining visibility, but engagement stayed resilient. Views fell modestly, yet clicks climbed across both timeframes—proof that intent is sharper, even as exposure narrows.
That mirrors what we’re seeing in the broader U.S. retail landscape: total consumer demand remains steady, but it’s more selective. Shoppers are price-sensitive, store format matters. and when they search, they search with purpose.
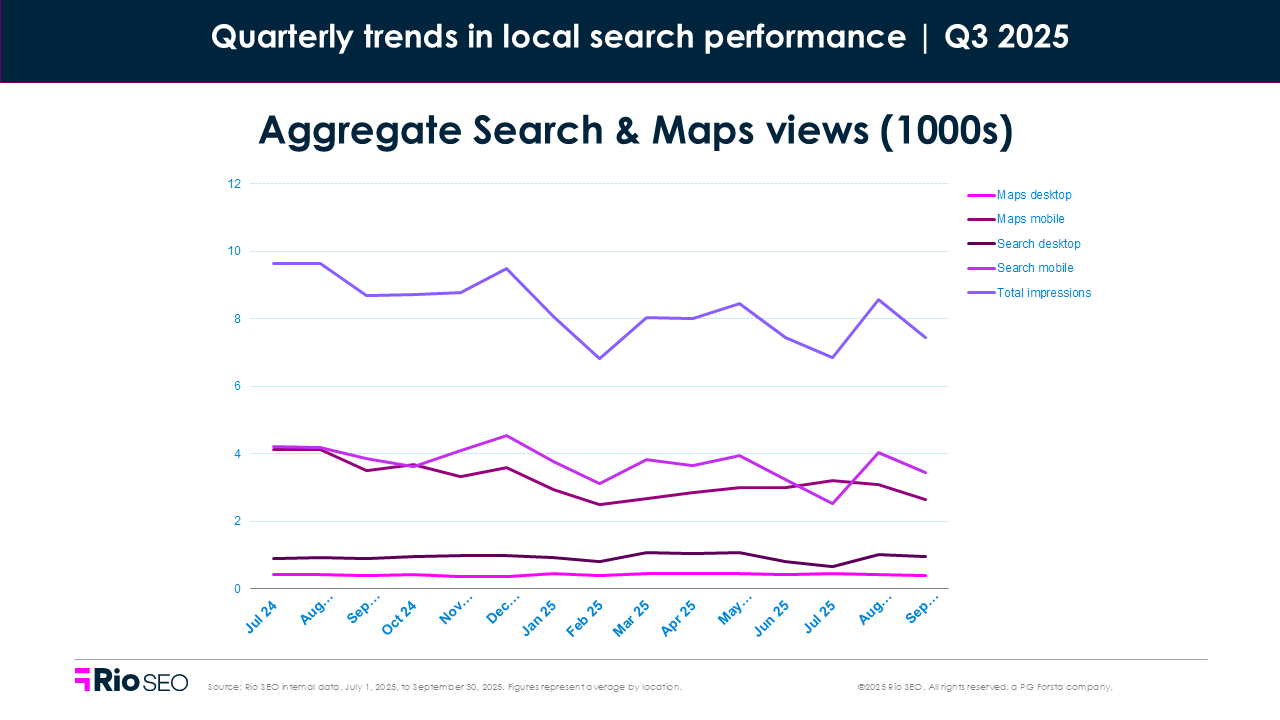
Map views rose slightly (+1.2%) while Search views dropped (–7.2%), mirroring the broader trend of AI summaries and interactive modules replacing traditional listings. Website clicks and phone calls dipped slightly (–3.9% and –3.0%, respectively), suggesting shoppers are relying more on listings themselves to decide.
Consumers are shopping with purpose, not impulse. Direction requests rose +9.2% QoQ and +18.5% YoY—evidence that people are still showing up, just through fewer, higher-intent entry points.
Collier projects 3.5–4.0% holiday sales growth and $1.7T in total spending, with 91% of consumers planning to shop both in-store and online. Retailers that emphasize clarity, convenience, and conversion-ready listings will be best positioned to capture this hybrid demand.
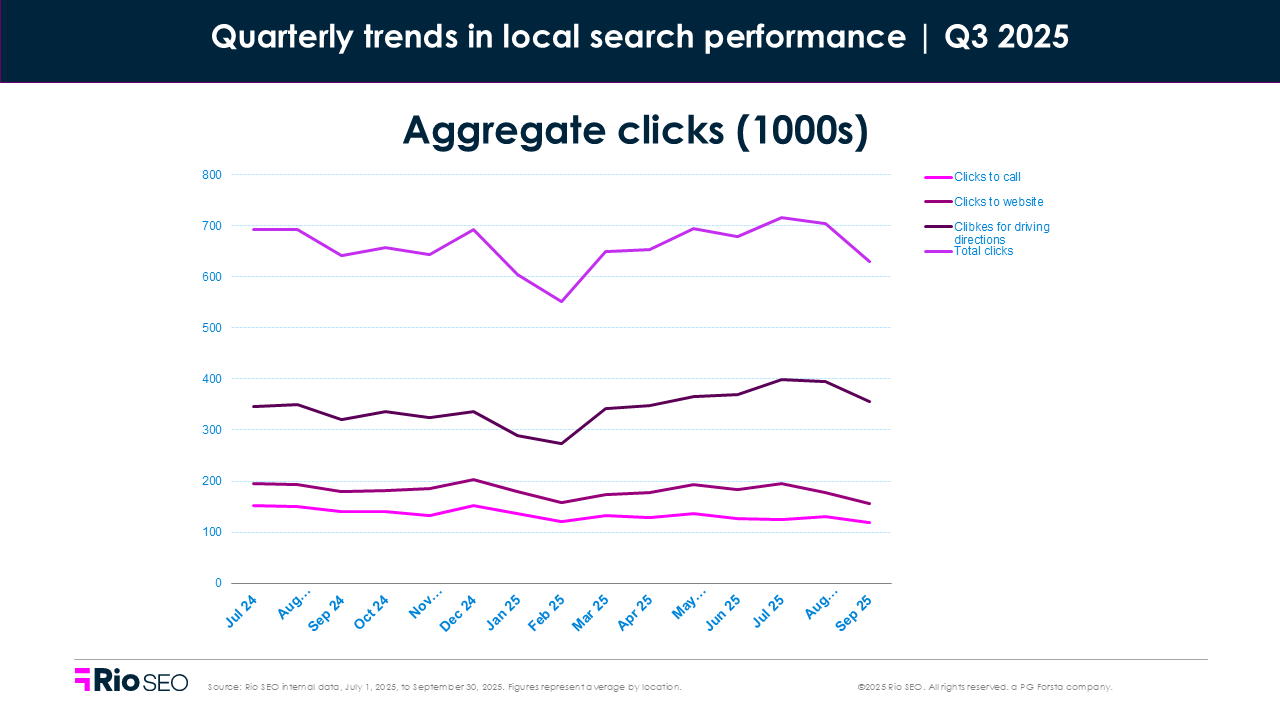
Total actions on listings climbed +11.3% from Q1 and beat last year’s volume by over 4%. Driving direction clicks saw the biggest gain, up +21.6% quarter-over-quarter and +14.4% year-over-year, a strong signal of in-person shopping intent.
Website clicks also rose (+6.1% QoQ), while phone calls dipped slightly (-1.4% QoQ), suggesting that shoppers may be relying more on self-service information available on the listing or website.
Engagement is back, even if views haven’t fully recovered. Not all impressions are created equal. Retailers saw fewer views overall compared to last year, but more meaningful engagement from the customers who did see them.
Where to focus next
- Watch the balance between Search and Maps views to guide content strategy.
- Activate local product feeds and inventory listings to surface real-time availability—especially critical for retail brands looking to capture “near me” and “in stock” searches.
- Identify top-performing stores and replicate what’s working.
- Keep listings fresh, including hours, categories, images, and fulfillment options.
- Maintain a strong reputation management program across all verticals; positive reviews and timely responses remain key ranking and engagement drivers within AI Overviews (AIOs).
- Drive fresh reviews and respond consistently to build trust.
- Support GBP with optimized local pages for key offerings.
Financial services
- Total Q3 2025 views: –4.9% QoQ, –24.9% YoY
- Total Q3 2025 clicks: +2.2% QoQ, -5.2% YoY
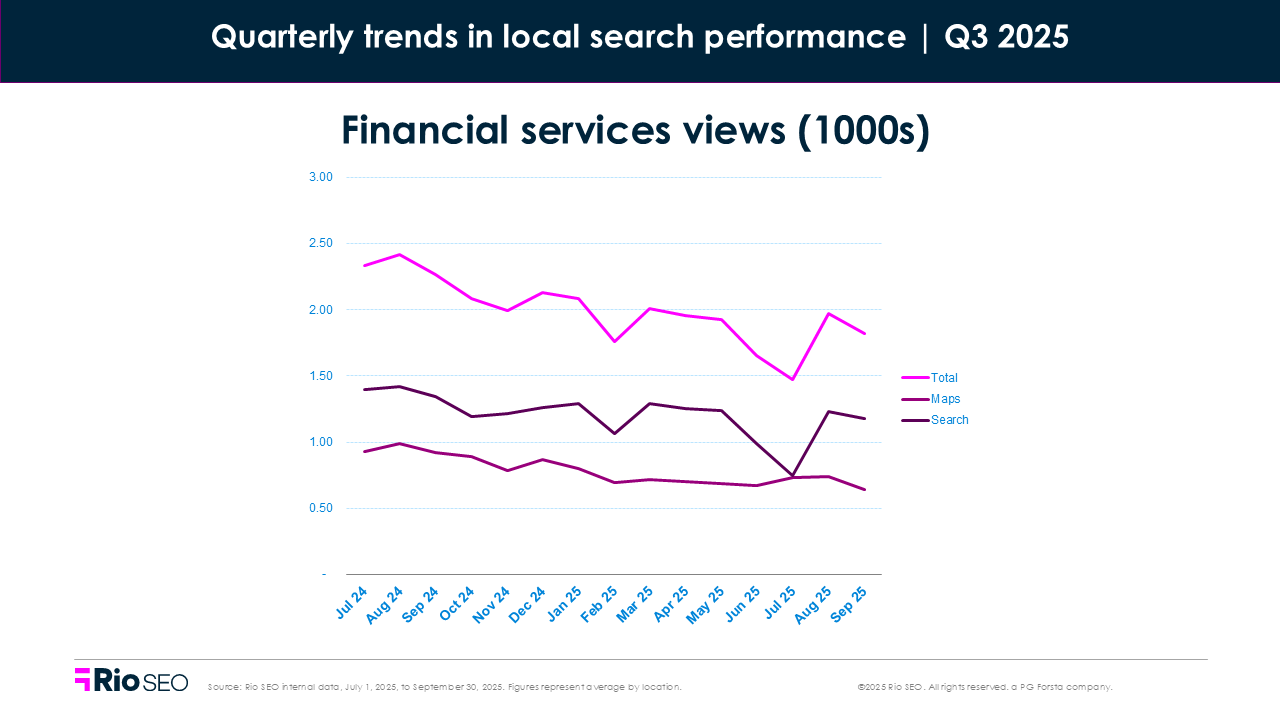
In Q3, financial services brands took a visibility hit but more than made up for it with a surge in engagement, mirroring the sector’s strong market performance.
Views dropped –24.9% YoY and –4.9% from Q2, making financial services one of the most visibility-impacted verticals this quarter. That YoY drop reflects both real shifts in Google’s SERPs and the June-July reporting gap, which skewed Search views heavily downward. Search views fell –9.2%, while Map views were up 2.4%. This doesn’t come as too much of a surprise as this industry tends to outperform in Q2 due to tax season.
But engagement told a different story: Clicks rose slightly +2.2% QoQ, a clear sign that users are acting fast when they find what they need. Direction requests were up +4.5%, and website clicks rose +2.0% — both modest but meaningful gains in a quarter where many industries saw flat or declining web traffic.
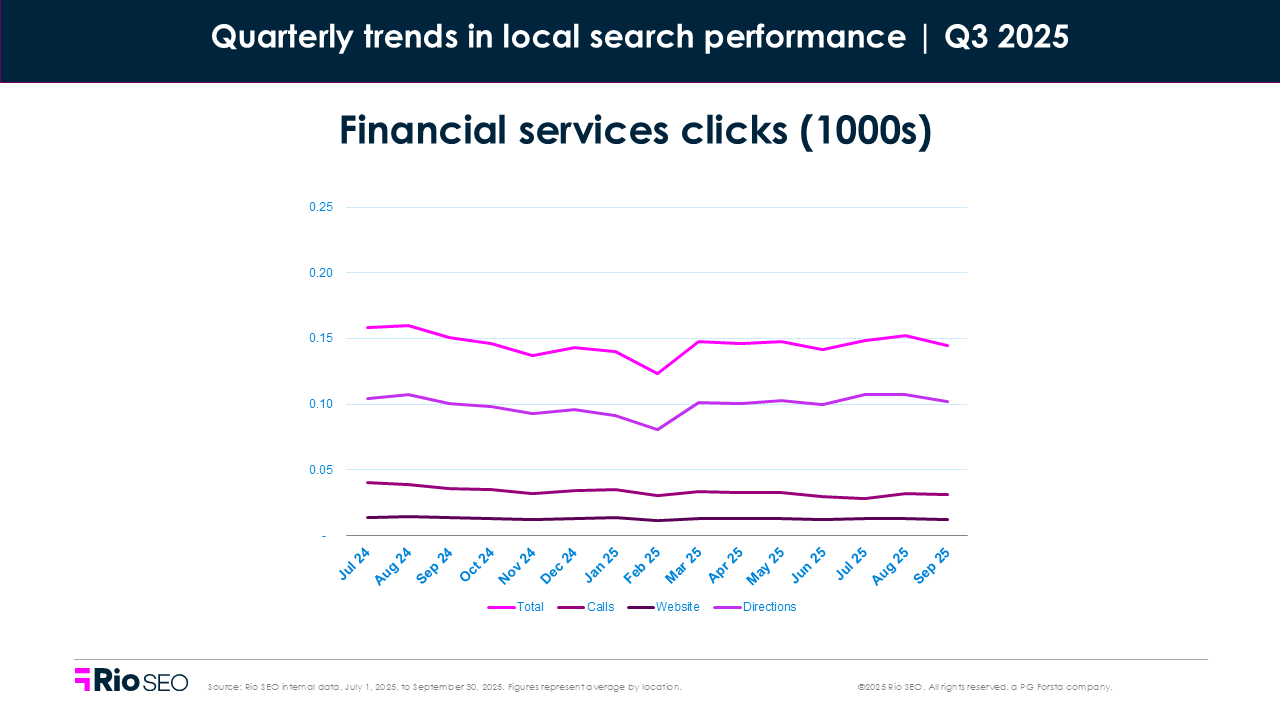
Phone calls dipped –4.1% QoQ but remain relatively stable compared to the steep YoY drop in views (–21%). That’s likely tied to Google’s recent mobile UI experiments, where users sometimes see only one CTA button (often directions) unless they tap into the listing.
Despite shrinking visibility, financial services listings are converting better. That speaks to stronger intent, clearer CTAs, and more users moving quickly once they find the right location.
This engagement lift mirrors renewed market confidence: JPMorgan Chase reported $8.9B in trading revenue, Bank of America’s investment banking revenue jumped 43%, and Morgan Stanley’s equities trading grew 35%. That momentum likely translated into higher local intent and branch interactions.
Where to focus next
- Audit branch and office listings for hours, services, and appointment links—every detail matters.
- Track direction and website clicks by location to spot demand and optimize staffing.
- Test CTA visibility on mobile; if “Call” and “Website” buttons aren’t showing, adjust layout or content.
- Use GBP attributes like “online appointments” or “ATM available” to boost relevance.
- Focus less on volume, and more on conversion: what users do > how many see you.
- Create professional listings for key staff (like loan officers, agents, or advisors) if your brand doesn’t already have them.
Service businesses
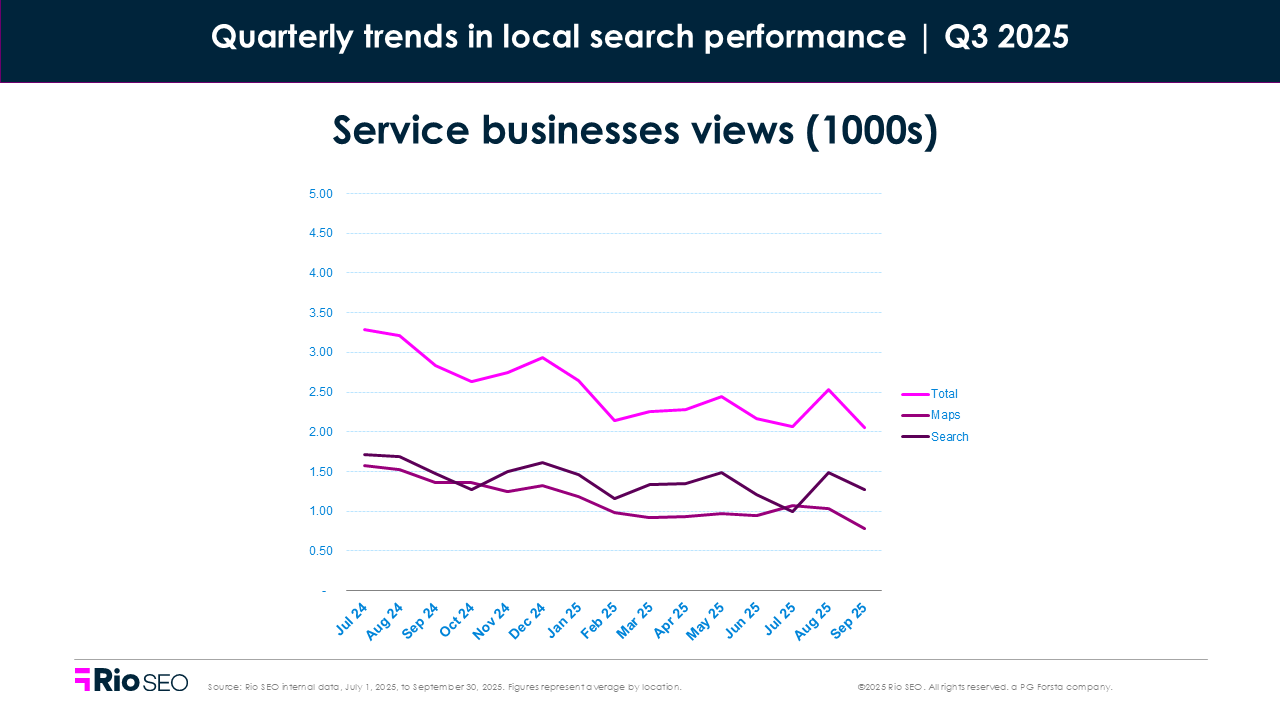
- Total Q3 2025 views: –3.5% QoQ, –28.8% YoY
- Total Q3 2025 clicks: –3.3% QoQ, –6.5% YoY
Service businesses took another hit in Q3 — especially in visibility — but engagement held better than expected.
Views dropped –3.5% from last quarter and nearly –28.8% year-over-year. That’s one of the steepest visibility losses across any vertical this quarter, driven by falling search views (–6.8% QoQ, –23.0% YoY) and mobile layout changes that continue to squeeze local listings.
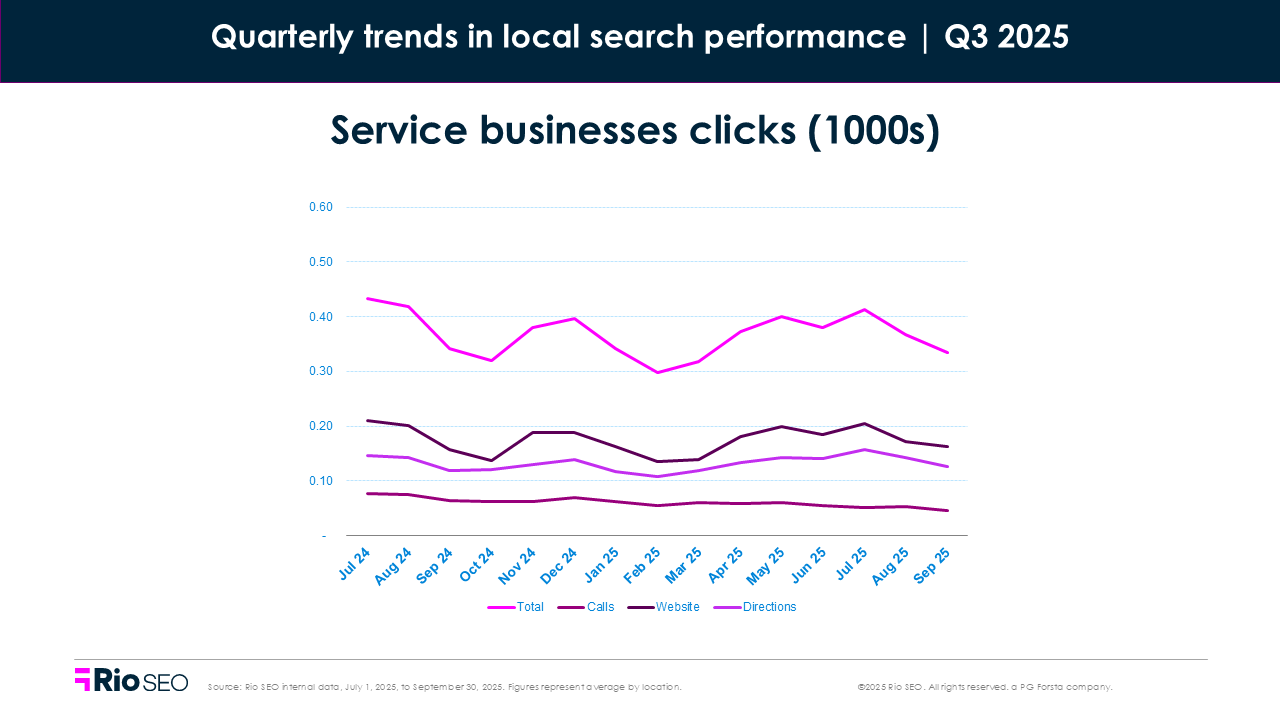
Clicks were down –3.3% QoQ and –6.5% YoY. It’s not a collapse, but a clear slowdown after a strong Q2 rebound. Phone clicks dropped sharply (–12.6% QoQ, –29.9% YoY), echoing the broader trend in which mobile users no longer see call buttons by default. Website clicks fell more modestly (–4.4% QoQ, –5.2% YoY), while direction requests rose slightly (+2.0% QoQ, +4.1% YoY).
The takeaway: With shrinking visibility and fewer interaction points, clarity and credibility are now differentiators.
Where to focus next
- Prioritize review quality and response time to reinforce trust.
- Keep listings fresh with current services, hours, and contact info.
- Highlight high-converting branches and align campaigns accordingly.
- Use website and direction click trends to track engagement hotspots.
- Monitor Map vs. Search view shifts and adapt visibility strategy.
- Add clear CTAs or chat features (like “Book Now,” “Call,” or “Chat with an Expert”) to create a seamless experience for high-intent customers ready to take action.
Healthcare
- Total Q3 2025 views: +0.1% QoQ, +0.6% YoY
- Total Q3 2025 clicks: +0.8% QoQ, +6.6% YoY
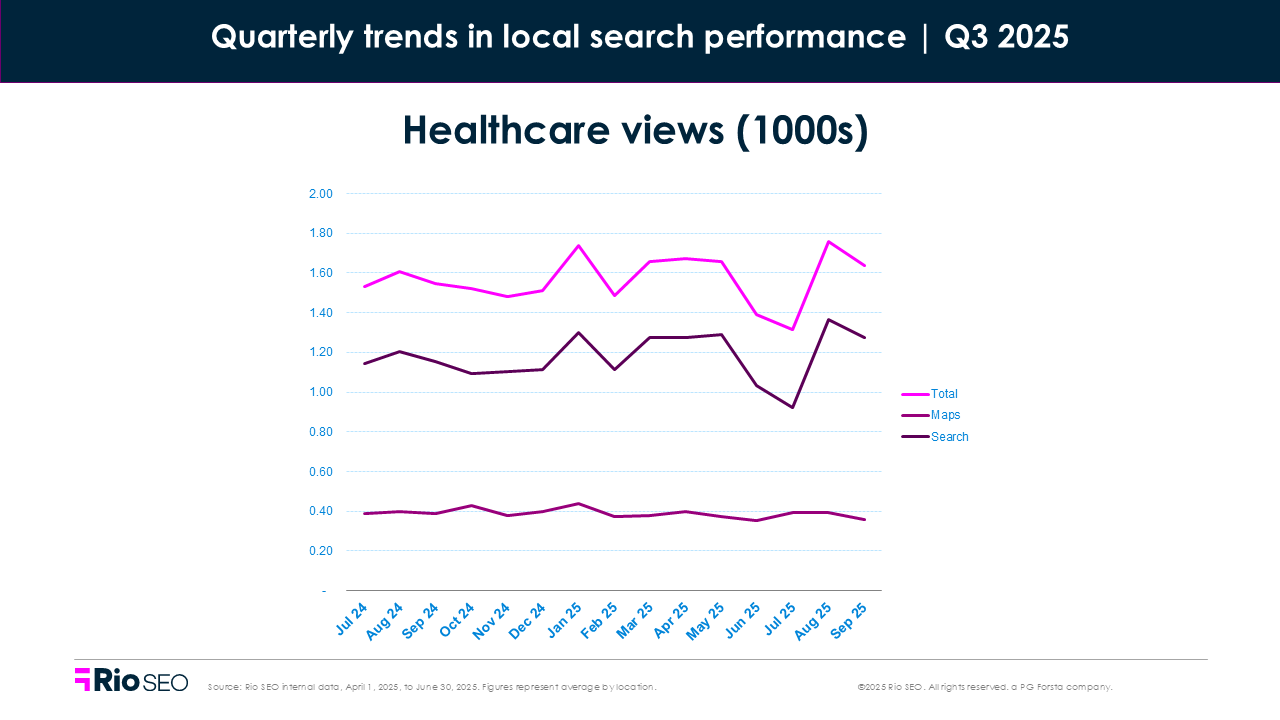
Healthcare brands stayed steady again in Q3, and that’s saying something. While most verticals wrestled with visibility drops and UI disruption, healthcare saw near-flat performance in views (+0.1% QoQ, +0.6% YoY) and a healthy rise in engagement (+0.8% QoQ, +6.6% YoY). That stability stands out in a quarter full of shakeups.
Search views slipped slightly (–0.6% QoQ), but Map views rose (+2.2%), helping offset the difference. Driving direction clicks jumped +7.7% QoQ and +19.4% YoY, a strong indicator that patients are still showing up, even if they’re starting their journey from fewer visible paths.
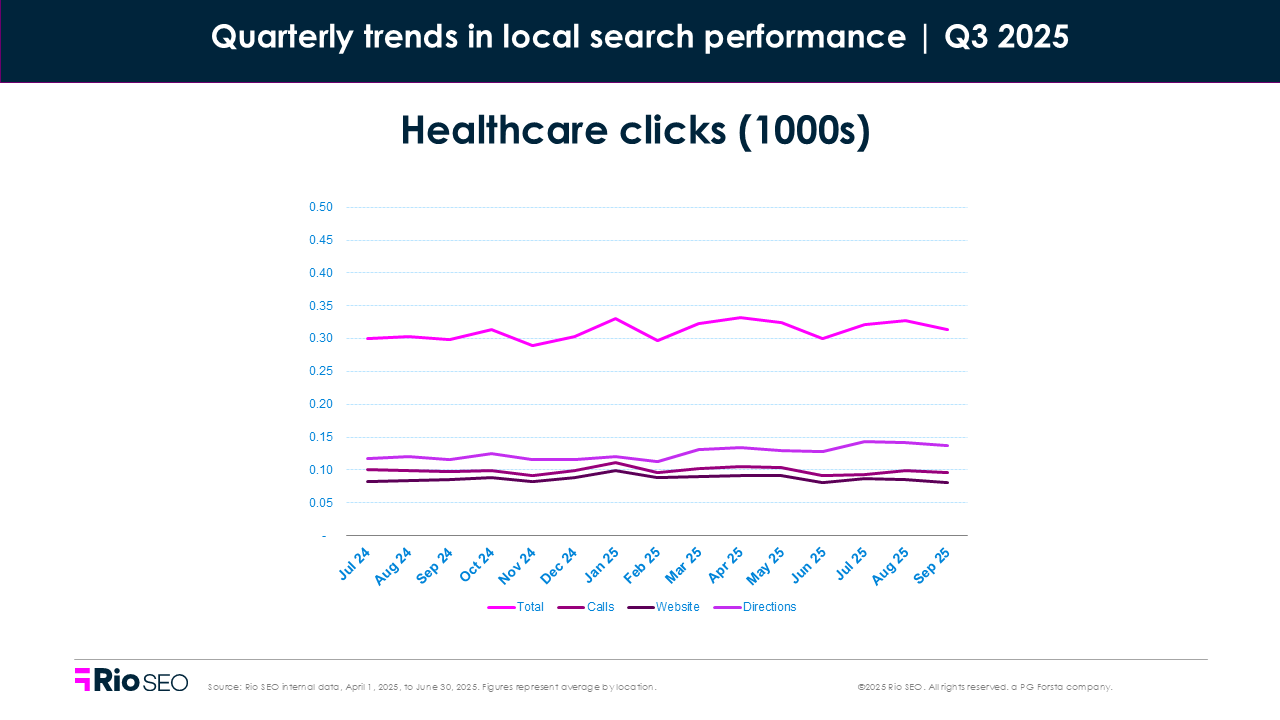
Phone and website clicks dropped modestly (–3.9% and –4.1% QoQ), but direction requests and total engagement made up the difference. It points to a shift in how patients are acting: fewer distractions, faster decisions.
That tracks with broader healthcare market dynamics. In Q3, the sector faced continued workforce constraints, rising outpatient demand, and growing reliance on temporary replacements to fill care gaps. Outpatient visits are projected to exceed 6 billion annually by 2035. It’s part of a sweeping shift away from inpatient care.
But access remains uneven. Roughly one-third of rural hospitals face financial risk, and more than 300 are at immediate risk of closure. That disparity affects how — and if — consumers find care.
Layer on top of that a persistent trust gap. Post-COVID skepticism runs deep, with patients wary of insurers, pharma brands, and even providers. That means accuracy in your listings isn’t just helpful, it’s foundational. If patients can’t trust what they see, they’ll go somewhere else.
Where to focus next
- Prioritize trust-building by making your listings complete, consistent, and up to date.
- Lean into both Google and Apple Maps, as strong Map visibility correlates with high-intent action.
- Highlight access points such as outpatient locations, hours, and scheduling links.
- Optimize for the moment with fewer clicks, more clarity, and faster action.
- Watch rural performance closely if you operate in mixed geographies.
Hospitality
- Total Q3 2025 views: –3.4% QoQ, –13.2% YoY
- Total Q3 2025 clicks: +1.1% QoQ, +4.2% YoY
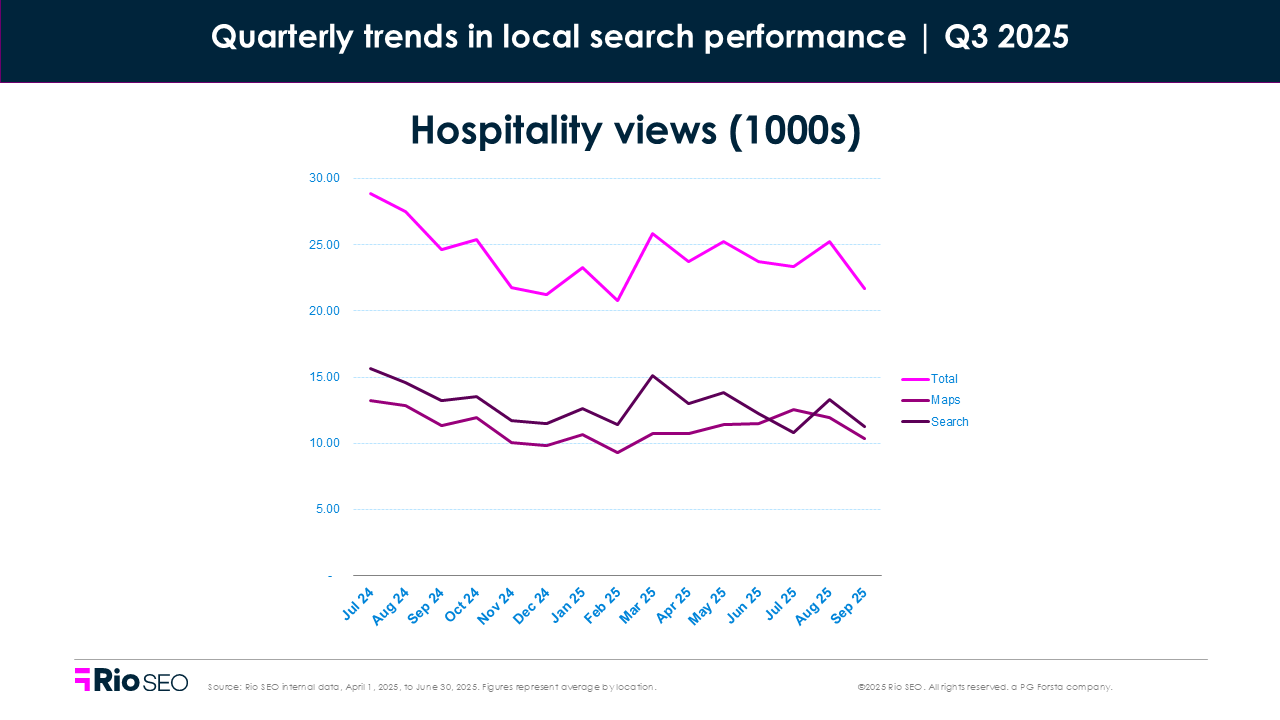
Hospitality brands The hospitality sector entered Q3 2025 in recalibration mode. After a year of post-pandemic travel recovery and elevated leisure demand, the market showed signs of softening. Lower international travel, rising operational costs, and mixed economic signals cooled earlier momentum. RevPAR growth slowed as forecasted, while occupancy hovered in the 62–63% range, just as PwC predicted earlier in the year.
That tempered demand showed up in local search, where total views dropped –3.4% from Q2 and –13.2% YoY. Organic visibility remained in flux, with Search views down –9.4% QoQ and –18.6% YoY, among the sharpest declines in any vertical. Map views, however, rose +3.5% QoQ, suggesting users are still navigating to listings but are doing so with more intent and less browsing.
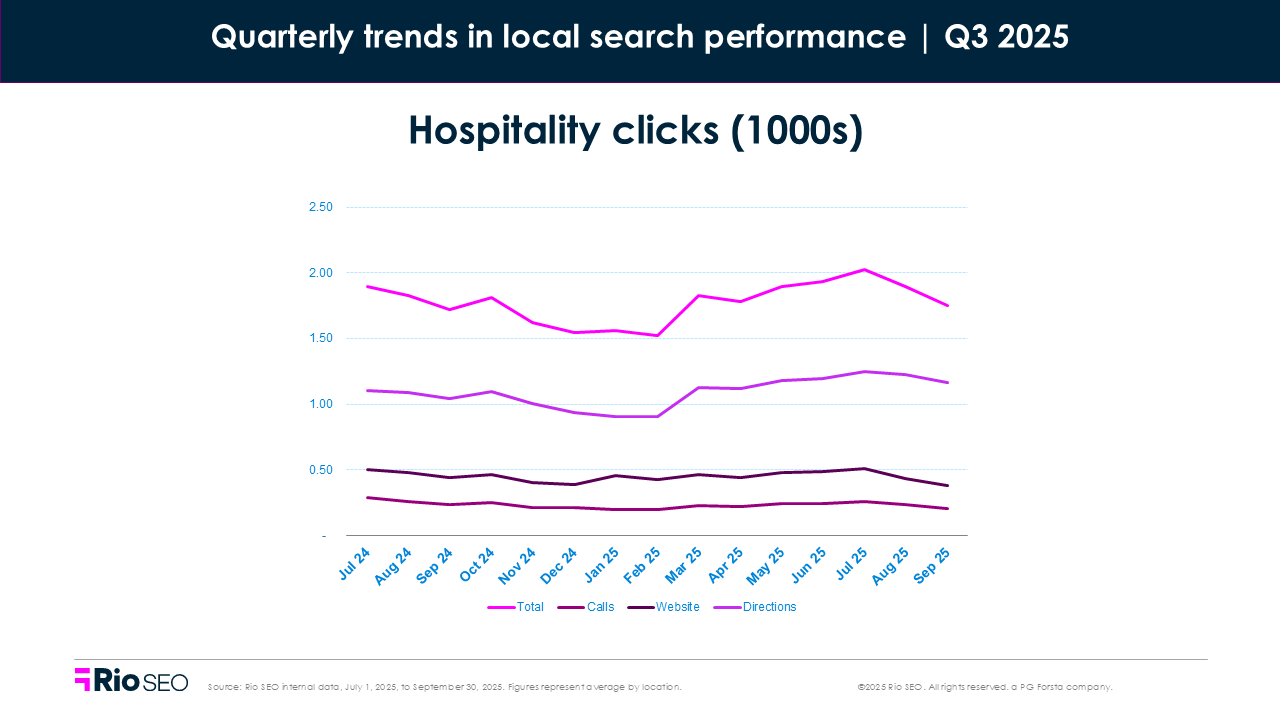
Total engagement tells a different story. Clicks climbed +1.1% QoQ and +4.2% YoY, driven by stronger performance across direction clicks (+4.1% QoQ, +12.7% YoY). That lines up with steady domestic leisure travel and the continued shift toward last-minute, mobile-led decision-making.
Website clicks dropped –5.7% QoQ, and phone calls dipped slightly (–0.4%), reflecting the mobile UI tests seen across Google and a growing preference for in-platform decision-making over outbound clicks.
Notably, direction clicks reached their highest levels since Q3 2024, signaling real-world foot traffic remains active, even as traditional visibility metrics decline.
Where to focus next
- Prioritize Maps visibility and accuracy, including Google and Apple Maps, for last-minute travelers.
- Ensure listings support direct bookings and highlight real-time availability.
- Track Search vs. Map performance, and shift your strategy accordingly.
- Audit mobile SERP appearance to ensure CTA buttons are visible and functional.
- Build in flexibility: travelers are still booking, just closer to arrival.
Restaurants
- Total Q3 2025 views: –10.1% QoQ, –36.3% YoY
- Total Q3 2025 clicks: –3.7% QoQ, –6.7% YoY
- Food orders per location: –10.4% QoQ, –46.5% YoY
- Food menu clicks per location: -11.2% QoQ, –16.8% YoY
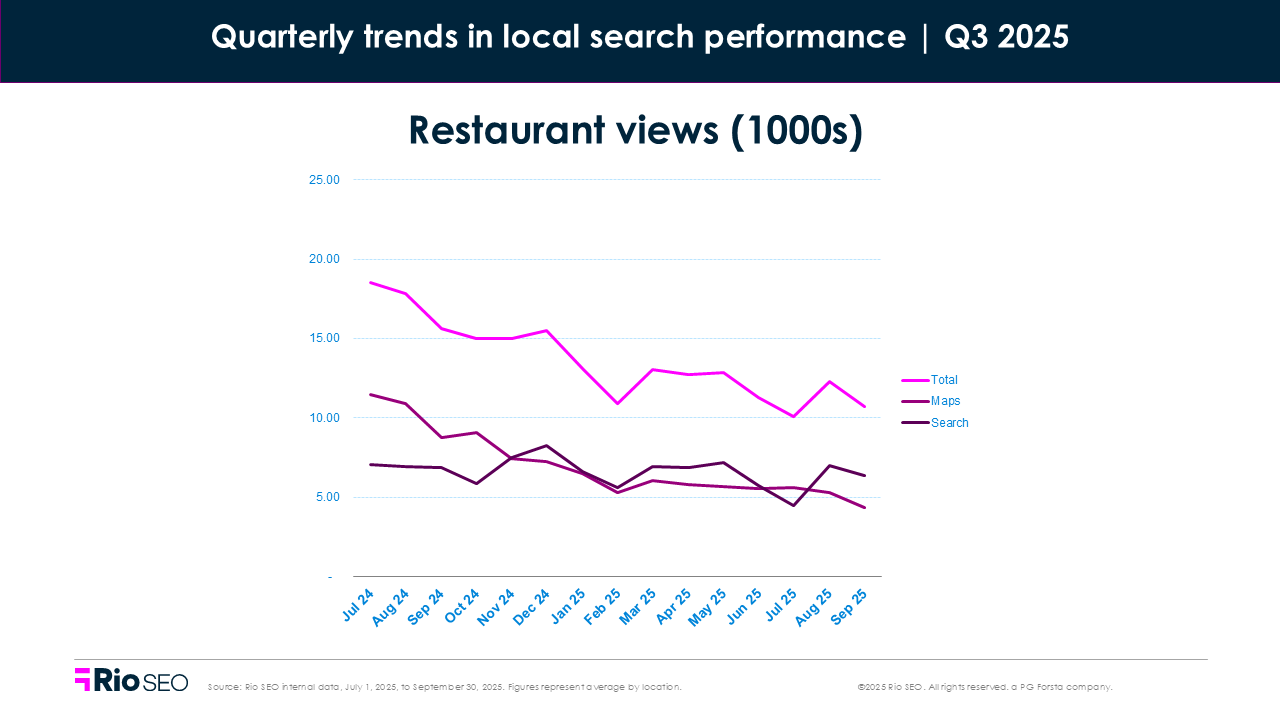
Google introduced expanded GBP (Google Business Profile) layouts in Q3 2025, particularly for restaurant queries, which occupied more screen space and altered user interaction patterns.
Q3 was a quarter of hard tradeoffs for restaurant brands, and that’s reflected in our location data.
Local search visibility for restaurants dropped steeply (–10.1% QoQ and –36.3% YoY), the sharpest YoY decline of any vertical this quarter. But even with fewer views, user engagement held its ground: total clicks declined only –3.7% QoQ and –6.7% YoY, pointing to a consumer base that’s smaller, but still actively searching and converting — when the value is right.
That gap between visibility and action highlights a key market truth: perceived value is driving restaurant traffic right now.
According to Black Box Intelligence, guests aren’t just looking for low prices; they’re looking for a good deal. That means generous portions, quality taste, and a consistent experience that justifies the cost. Restaurants delivering on that equation are earning repeat visits and outperforming the pack.
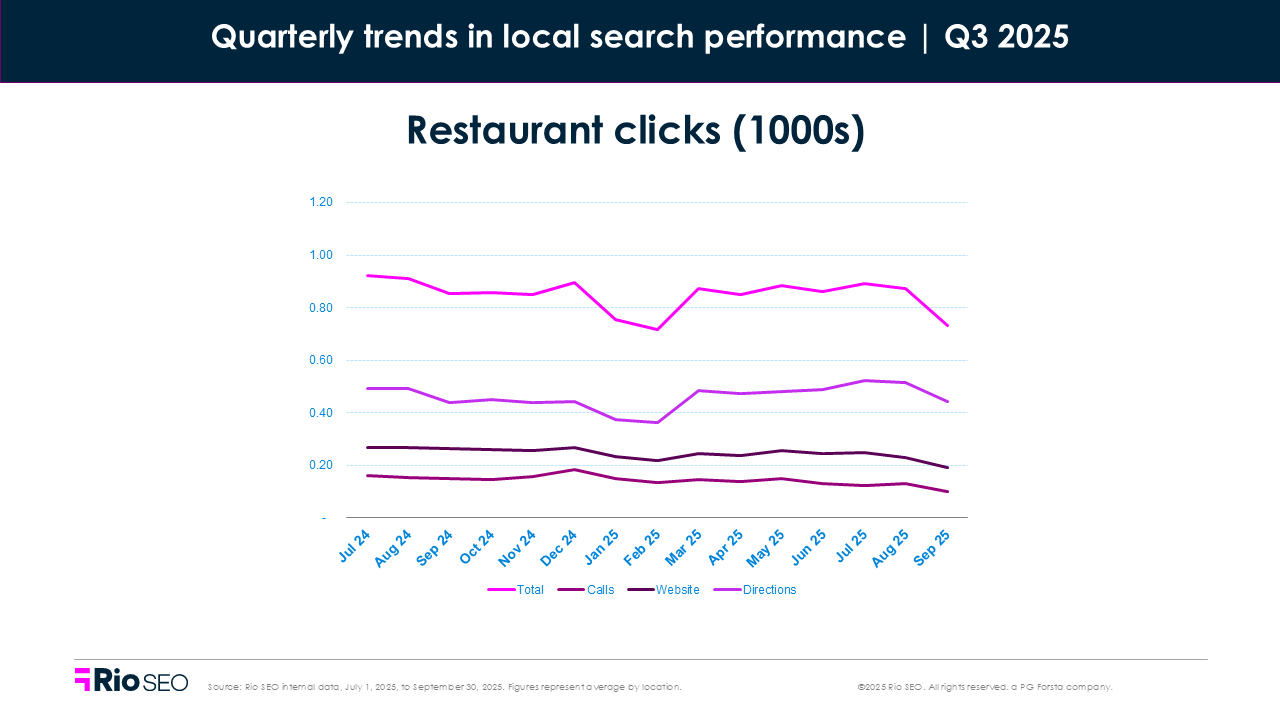
The numbers reinforce that pattern:
- Food orders per location dropped sharply (–10.4% QoQ, –46.5% YoY), showing pressure on digital conversions and third-party platforms.
- Driving direction clicks rose +2.6% QoQ and +4.3% YoY, showing that even with visibility down, customers are still showing up in person when the perceived value is high.
- Meanwhile, phone calls and website clicks continued to decline (–15.4% and –9.3% QoQ, respectively), likely tied to changing UI layouts and more selective consumer behavior.
Restaurant visits are no longer automatic. Consumers are doing the math. Whether it’s casual dining’s recent outperformance, fast casual’s consistency, or quick service’s softness, one message cuts across the board: you win by making the choice easy, and worth it.
Where to focus next
- Highlight perceived value in listings, menus, and local ads, emphasizing portion size, food quality, speed, and atmosphere, not just price.
- Prioritize review generation by actively asking for reviews, especially from satisfied in-store guests.
- Keep menus and photos fresh. Rising menu click activity signals that more customers are checking listings before visiting, so make sure they like what they see.
- Watch direction clicks, as they continue to be a strong signal of real-world traffic, especially as phone calls and website clicks decline.
- Ask better questions in post-visit surveys, emails, or SMS, such as “Was the portion size worth the price?” or “How would you rate the quality of your meal for the cost?” These prompt value-based responses that help you refine messaging and operations.
- Test and track order CTAs: Food orders are down, so experiment with new language, delivery promos, and clearer paths to action.
Multi-family residential
- Total Q3 2025 views: +4.1% QoQ, +14.5% YoY
- Total Q3 2025 clicks: –5.9% QoQ, –9.2% YoY
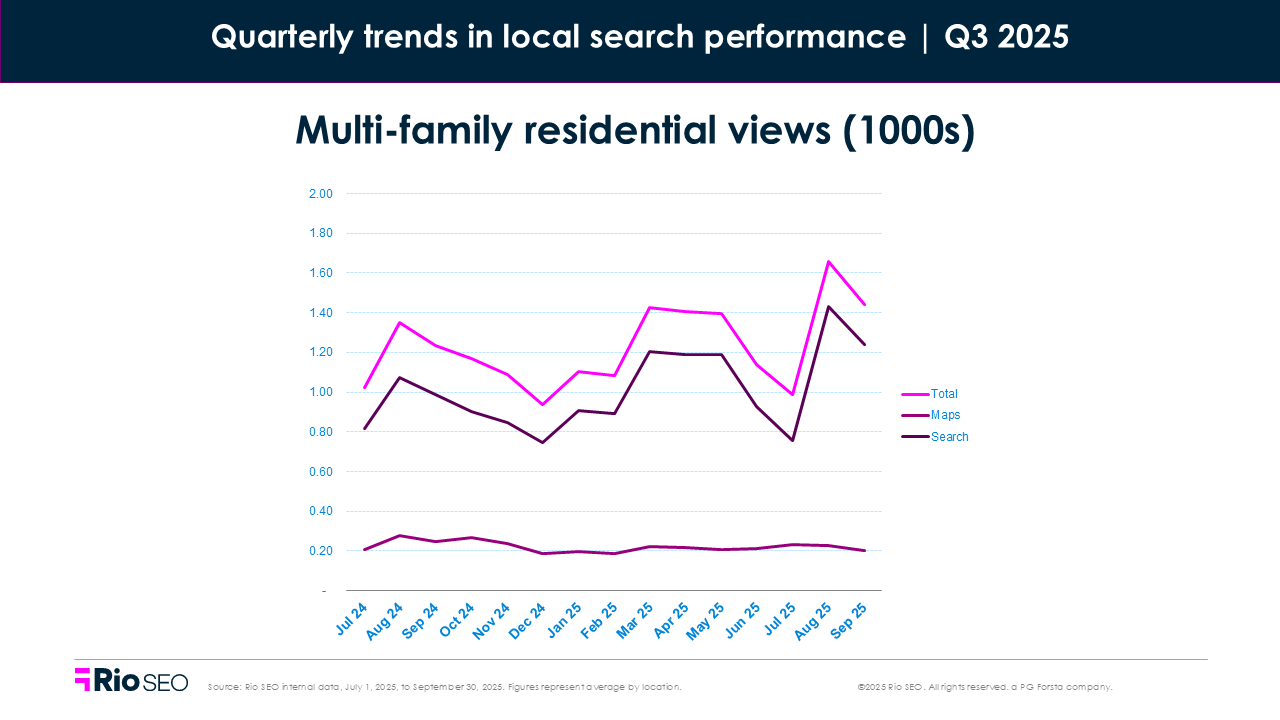
Multi-family listings gained visibility in Q3, with views rising both quarter-over-quarter (+4.1%) and year-over-year (+14.5%). This continued a modest recovery in local exposure as renter demand held steady in most markets and stabilized vacancy levels signaled stronger competition for qualified tenants.
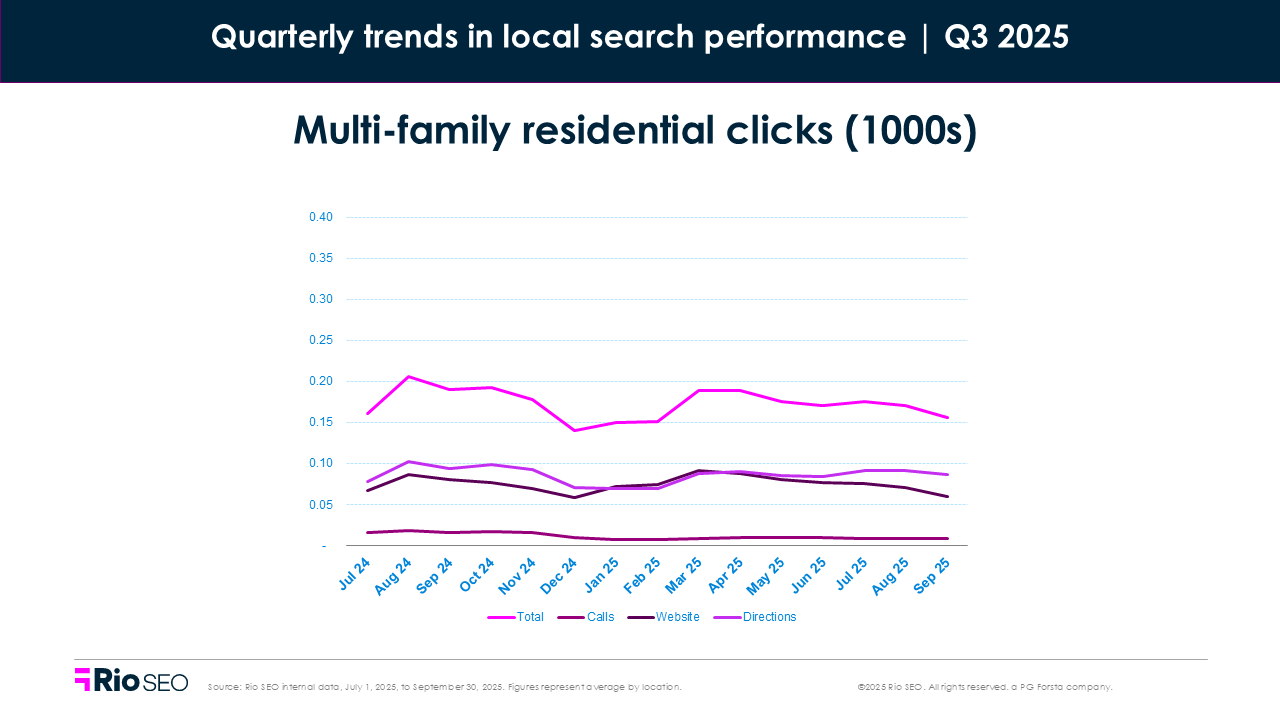
But despite more eyes on listings, clicks declined –5.9% QoQ and –9.2% YoY, a sign that interest isn’t always translating to action. Website clicks fell –15.5%, and phone inquiries dropped –9.2%, suggesting that some listings may be drawing casual browsers, not serious prospects. The one exception? Driving direction clicks, which climbed +3.5% — a potential indicator of localized, high-intent interest.
On the market side, vacancy rates held steady around 9% nationally, but stabilized vacancy (excluding new builds) rose slightly as concessions became more common to attract tenants. Rental rates continued their gradual upward trend, with Q3 showing modest growth (e.g., +1.3% YoY in Virginia). However, delivery slowdowns may begin to tighten inventory and drive stronger rent growth into 2026.
Together, the performance and market data point to a shift: interest is still there, but conversion hinges on relevance, clarity, and competitive differentiation. Simply being seen isn’t enough. Listings need to earn the next step.
Where to focus next
- Audit listings for clarity, making sure key information such as rent ranges, availability, lease terms, and pet policies is immediately visible and accurate.
- Refresh visual content with high-quality, up-to-date photos and virtual tours increase the odds of turning a view into a visit.
- Capture local intent by prioritizing local SEO, Google Business Profile (GBP) accuracy, and geo-targeted ads.
- Track and test CTA performance, and if web clicks are soft, revisit your calls to action and landing page experience.
- Lean into leasing incentives. If offering concessions, make them visible early in the search journey to stand out from competing properties.
Rethinking local visibility in 2025 and beyond
From shifting algorithms to changing consumer expectations, Q3 2025 made one thing clear: local visibility isn’t guaranteed, but action still is. The brands seeing growth aren’t just showing up… they’re showing up ready. That means listings built for conversion, content built for trust, and strategies built to adapt.
Want to know where you stand? Request your free local audit to uncover hidden gaps, growth opportunities, and tips tailored to your brand.
Related resources

Leading mobility company turns reputation management into a powerful acquisition and revenue driver

evo: Turning reputation into a growth engine
Solotel: Using guest feedback to drive visibility, engagement, and better decisions
Newsletter
Get industry insights that matter, delivered direct to your inbox
We collect this information to send you free content, offers, and product updates. Visit our recently updated privacy policy for details on how we protect and manage your submitted data.