Local consumer search behavior trends in Q2 2025

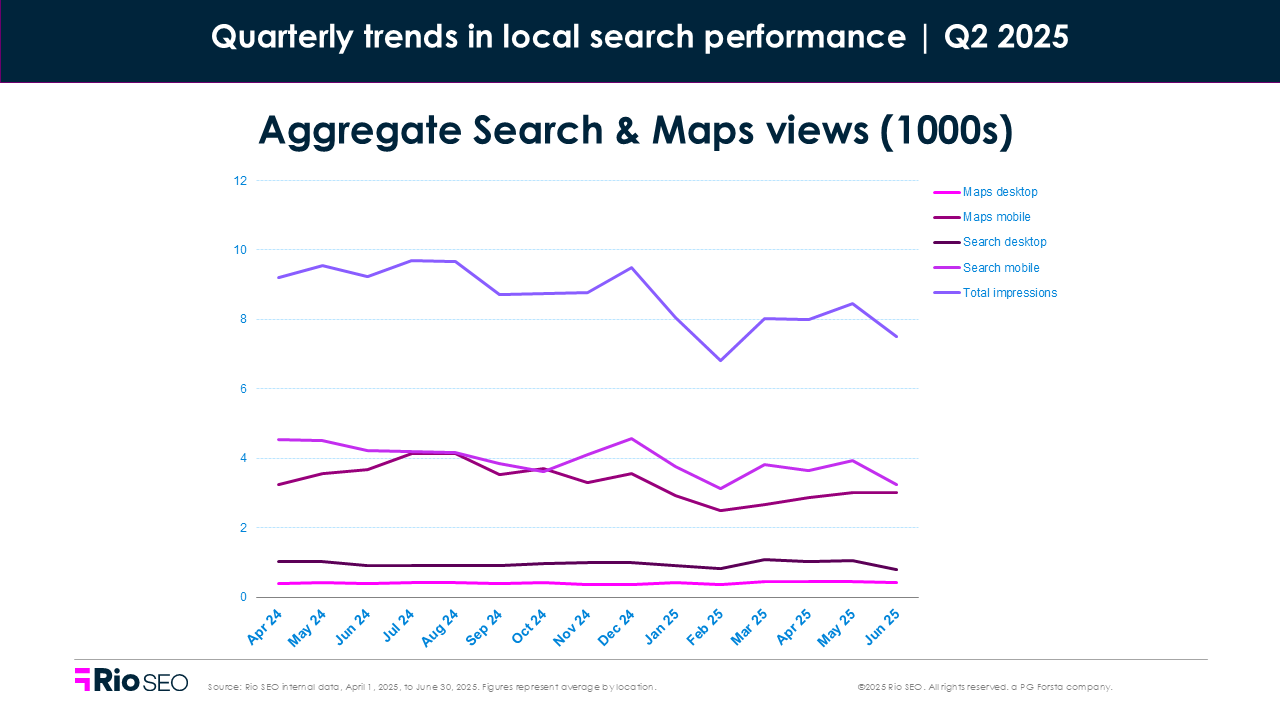
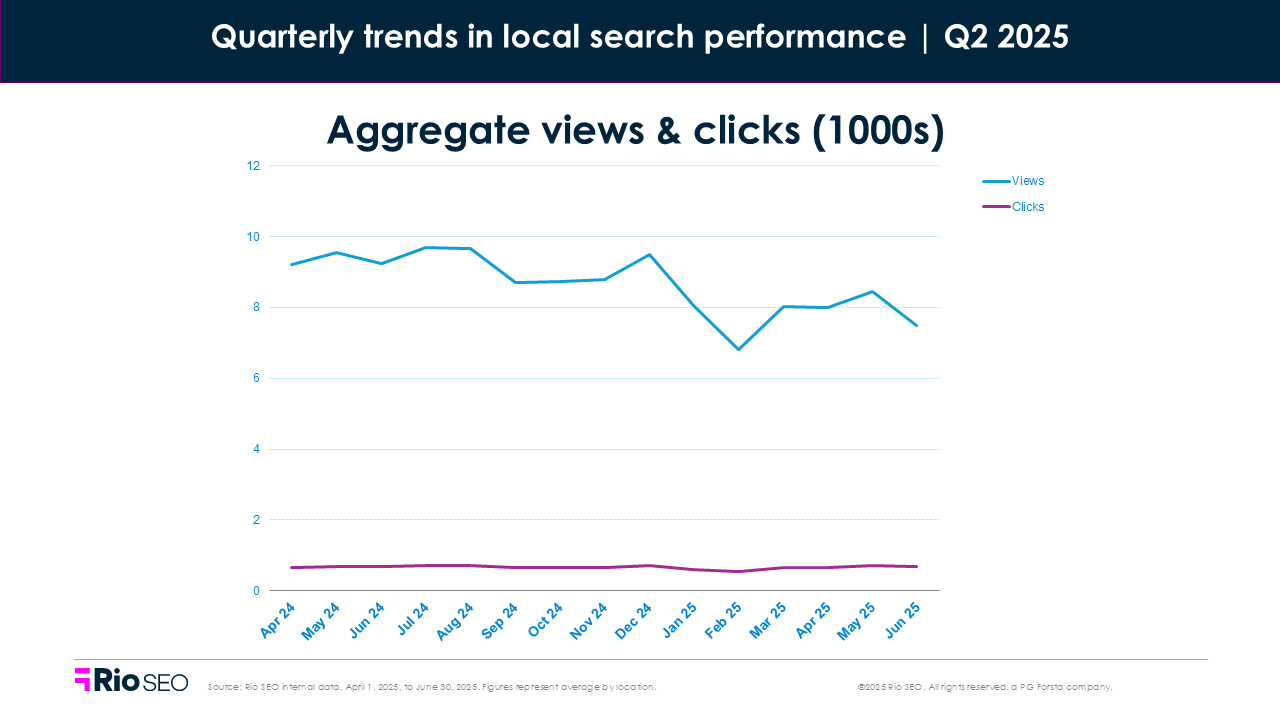
Across thousands of enterprise locations, Google views are dropping. Hard. Since 2022, total search impressions are down nearly 30% and search views have fallen by 40%.
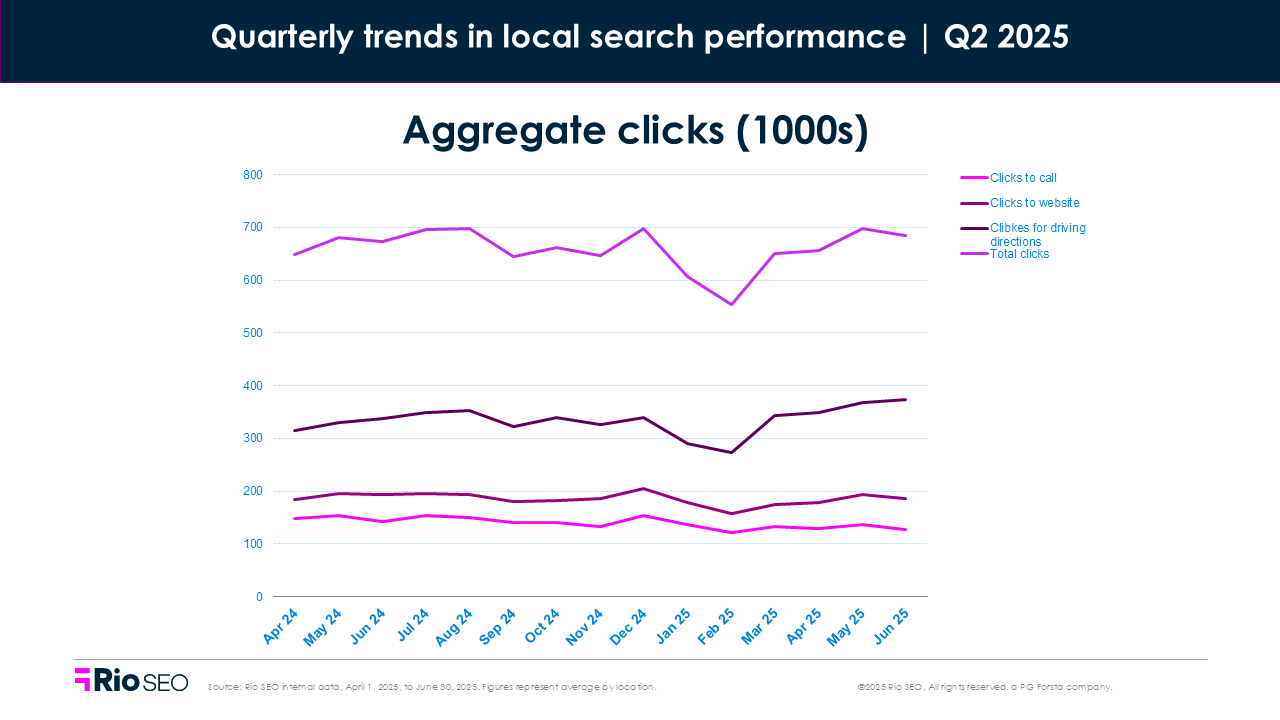
Website clicks? Shrinking. Yet somehow, the total number of clicks has held steady. So what’s happening?
In short, Google is reshaping how people find businesses (or don’t). Traditional search results are getting squeezed. Now AI summaries, map packs, and richer SERP features are stealing the spotlight. Organic listings are being overshadowed by bots and bundles.
And it shows:
- Retail views have been sliced in half since 2022
- Restaurant visibility crashed 18% in a year
- Website traffic is falling across every vertical
But it’s not all decline. Direction requests are up, phone calls are steady, and map views have quietly become the main stage. That tells us something important: customers still want to visit your locations; they’re just reaching you through fewer entry points.
Still, it’s not universal. In many industries, especially those less reliant on appointments or in-person visits, web and call clicks are slipping. Zero-click searches are eating into engagement, and the impact gets masked in aggregate by stronger performance from sectors like healthcare and services. That’s why it’s more important than ever to zoom in by vertical.
The impact of the June Google core algorithm update
Between June 24 and 25, we observed an abrupt decline in mobile search impressions across nearly every vertical we track, including retail, staffing, and financial services. Yet engagement metrics — clicks, calls, direction requests — held steady. That suggests user behavior didn’t change. What changed was how Google reported visibility.
Here’s what we know:
- Google officially launched its June 2025 Core Algorithm Update on June 30
- Volatility in impressions started as early as June 24, especially on mobile
- The rollout lasted until July 17, with ranking fluctuations continuing throughout
- There were no changes to engagement, suggesting a shift in how impressions are measured or reported
Some in the industry flagged a possible reporting glitch. Others believe this reflects deeper SERP changes or AI Overviews suppressing standard listings. Either way, the pattern is clear, and it’s global.
Impressions are down. Actions are stable. The signal is shifting.
That’s why we’re watching this trend closely. And while impressions have never been a perfect metric, they still shape how brands evaluate visibility. This quarter’s data reflects that shift. So does the response from enterprise marketers: optimize for action, not just appearance.
Our Q2 2025 local consumer search trends analysis breaks down how search behavior is evolving, where it’s holding strong, and what your next move should be.
Year-over-year local search trends
Compared to Q2 2024, most enterprise brands saw a sharp drop in local search visibility. Total impressions fell across five of the seven verticals we track — some by more than 30%.
Financial services and restaurants were hit hardest, with views down –21.3% and –35.0% YoY, respectively. Business services saw the steepest decline overall at –30.2%, pointing to sustained disruption in how users discover service-based locations.
Retail and hospitality also lost ground, with total views down –8.3% and –5.0% YoY. In both cases, Search visibility fell further than Map impressions, likely due to changes in SERP layout and the growing influence of AI-generated summaries.
Only healthcare and multi-family residential bucked the trend. Healthcare saw a modest +8.3% YoY gain in visibility and a +4.3% increase in total clicks — one of the only categories with consistent growth. Multi-family views also climbed slightly YoY (+4.3%), though click-throughs fell -12.3%, pointing to a growing gap between exposure and engagement.
What’s clear is that brands that rely on visibility alone are losing ground. It’s no longer enough to show up; your listing has to work harder to win the click.
Quarter-over-quarter local search trends
Q2 2025 brought a much-needed rebound in engagement, even as total visibility remained uneven.
Retail led the way with a +7.3% QoQ gain in views and +11.3% jump in total clicks. Restaurants held flat on views but saw clicks climb +11.1%, while hospitality impressions rose +4.1%, backed by a +13.8% lift in actions. Those three verticals alone show a clear trend: even if reported visibility is uneven, real interest hasn’t faded. When listings work, users follow through.
Business services followed a similar pattern, with views down slightly (–2.1%) but clicks up +20.9%. Multi-family brands gained on both fronts, with views up +9.0% and clicks up +9.3% QoQ — a positive shift after a quiet Q1.
Healthcare remained steady, with only small changes in either direction. But financial services continued to struggle, with views down another –10.3%. Still, a +6.8% QoQ rise in clicks shows that users who do find the right listings are acting.
Taken together, the data tells a consistent story: impressions are down, but engagement is up. That points to a shift in what Google is counting, not a drop in audience. It’s a signal to optimize not just for visibility, but for velocity. Cut friction, sharpen content, and focus on high-intent CTAs beyond just direction clicks… think ‘schedule an appointment’ or ‘order now’ links.
Now, let’s take a deeper look at the eight verticals we track.
Retail
- Total Q2 2025 views: +7.3% QoQ, -8.3% YoY
- Total Q2 2025 clicks: +11.3% QoQ, +4.3% YoY
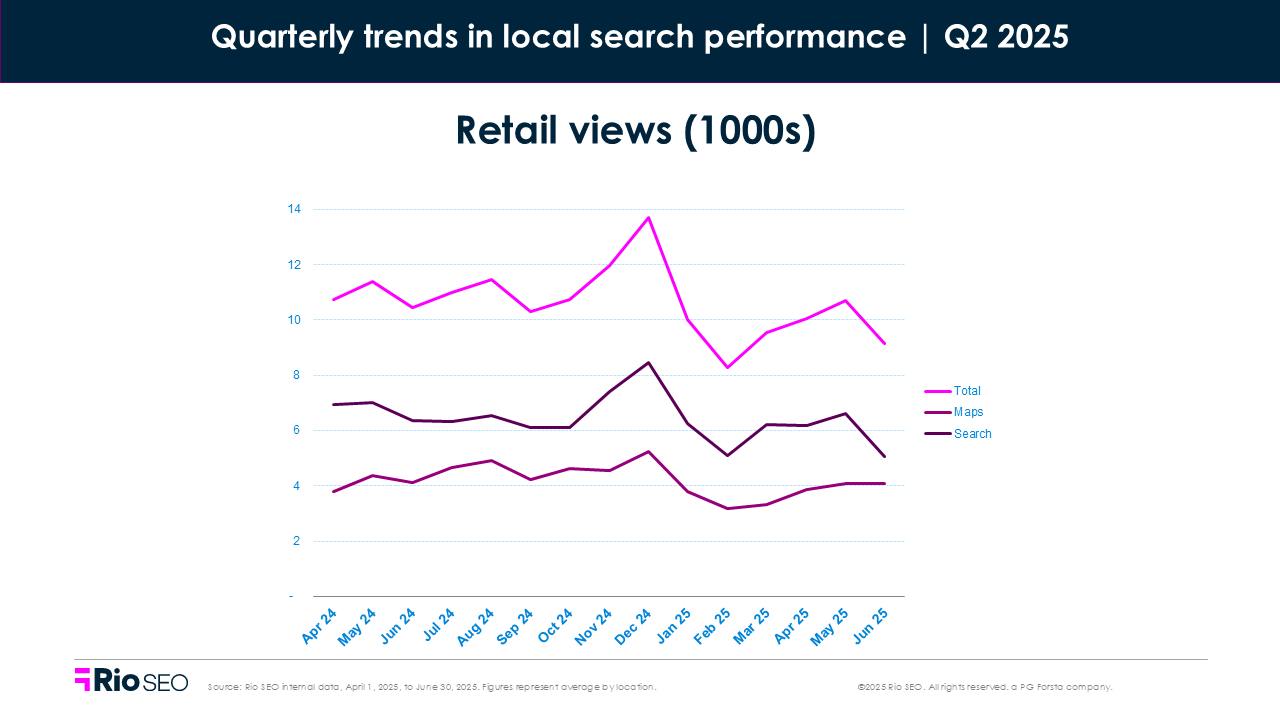
Retail brands saw a solid rebound in Q2, reversing much of the Q1 downturn. Total views rose +7.3% quarter-over-quarter — a meaningful recovery, though not enough to overcome the -8.3% drop from the same time last year.
Search views led the way, jumping nearly 17% from Q1, signaling renewed top-of-funnel activity. But not all impressions rebounded equally. Map views, while slightly up quarter-over-quarter (+1.7%), remain down -12.2% year-over-year compared to Q2 2024 — a likely result of shifting search behavior and AI-powered result formats reducing traditional Map exposure.
Clicks tell a different story — one of growing intent.
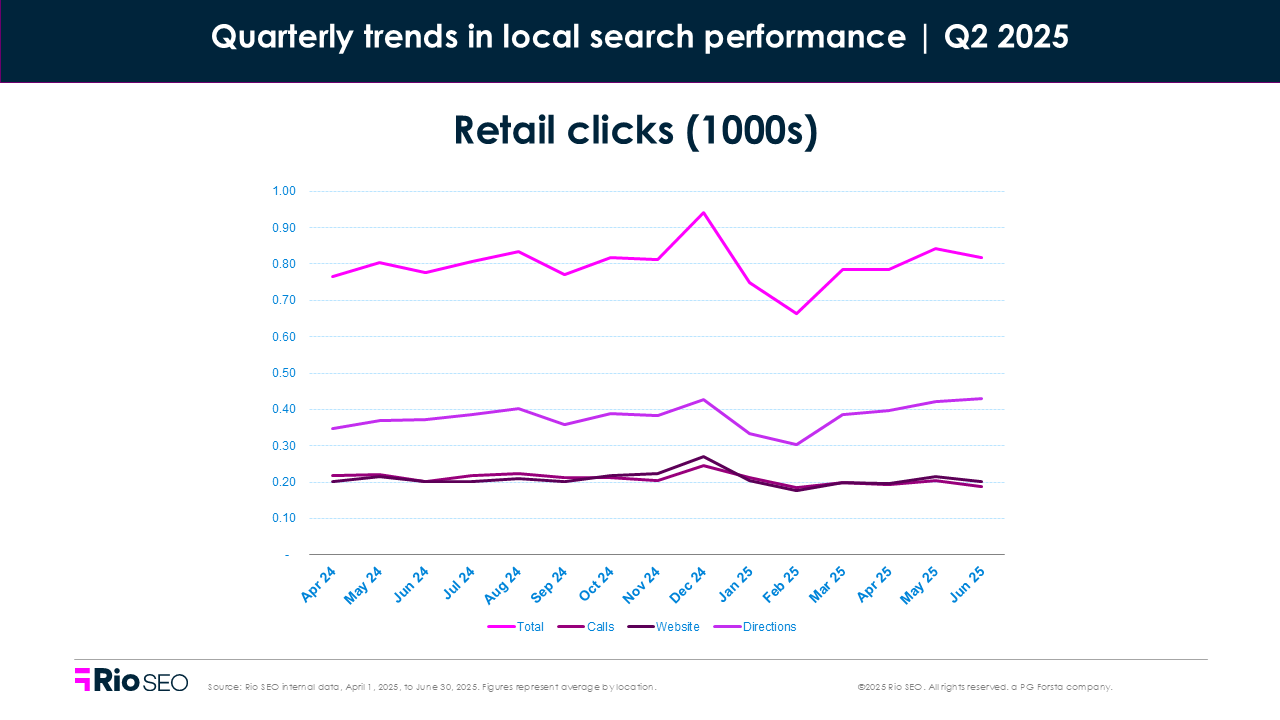
Total actions on listings climbed +11.3% from Q1 and beat last year’s volume by over 4%. Driving direction clicks saw the biggest gain, up +21.6% quarter-over-quarter and +14.4% year-over-year, a strong signal of in-person shopping intent.
Website clicks also rose (+6.1% QoQ), while phone calls dipped slightly (-1.4% QoQ), suggesting that shoppers may be relying more on self-service information available on the listing or website.
Engagement is back, even if views haven’t fully recovered. Not all impressions are created equal. Retailers saw fewer views overall compared to last year, but more meaningful engagement from the customers who did see them.
Where to focus next
- Watch the balance between Search and Maps views to guide content strategy
- Identify top-performing stores and replicate what’s working
- Keep listings fresh, including hours, categories, images, and fulfillment options
- Drive fresh reviews and respond consistently to build trust
- Support GBP with optimized local pages for key offerings
Financial services
- Total Q2 2025 views: -10.3% QoQ and -21.3% YoY
- Total Q2 2025 clicks: +6.8% QoQ, -3.5% YoY
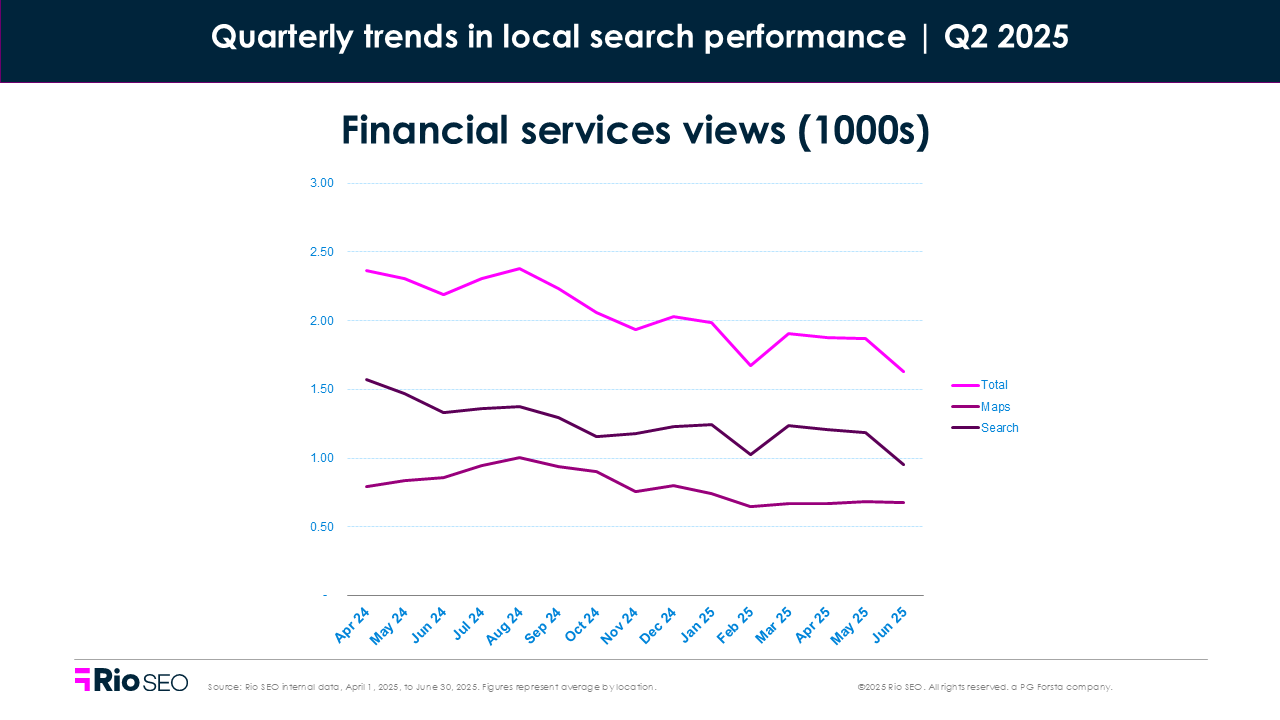
Q2 brought a mixed bag for financial services brands. Visibility continued to decline, with total views down -3.4% from Q1 and now -21.6% compared to the same period last year. Search views saw the sharpest drop, falling another -4.6% QoQ, on top of already steep Q1 losses.
That suggests fewer local discovery moments — especially on mobile — as users increasingly skip the map and scan summaries or AI-generated results instead.
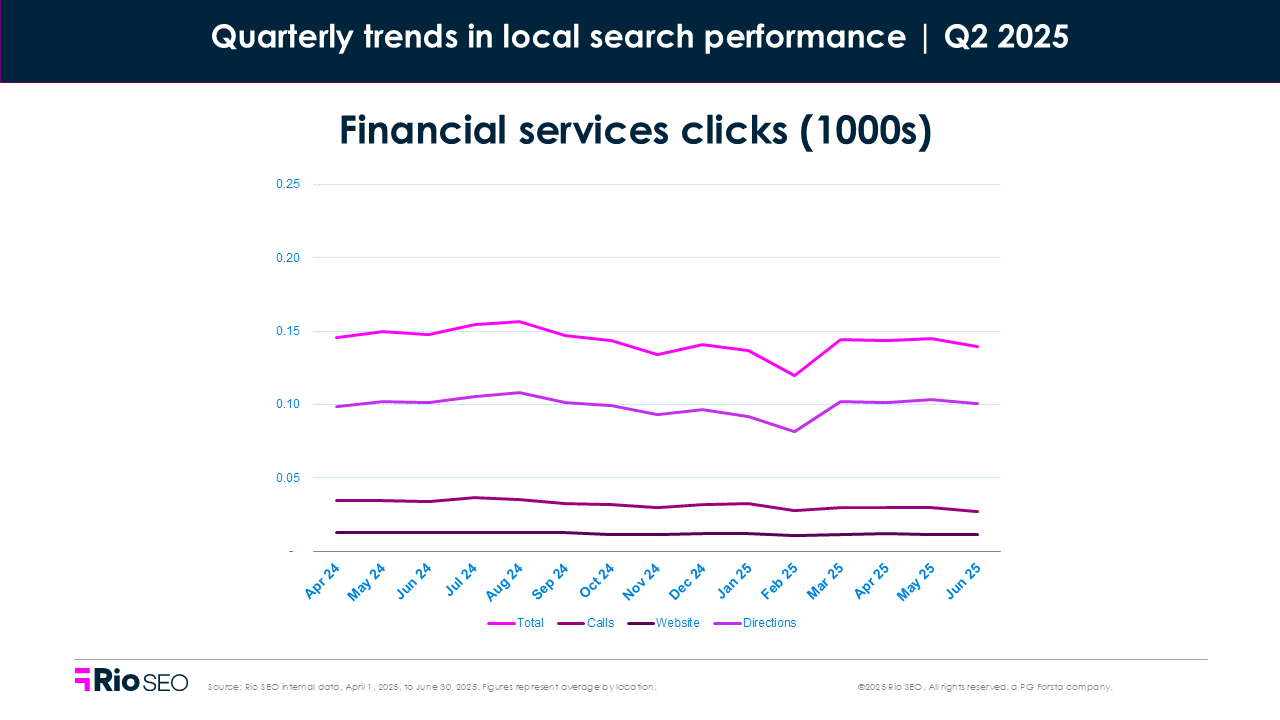
But here’s what stands out: Clicks went up. Total actions on listings rose +6.8% QoQ, with driving direction clicks leading the recovery at +11.0%. That marks the first YoY lift in driving clicks since 2023. It’s a sign that high-intent customers are still navigating their way to branches when they find the right info.
Phone clicks and website visits, on the other hand, remained flat or declined. Phone actions dropped -3.3% QoQ, and website clicks were unchanged from Q1 but still -8.4% below last year. That may point to friction in how listings present next steps, or to customers relying more on listings and reviews to make decisions without ever clicking through.
With fewer total views but more engagement, Q2 confirms what we’ve seen brewing: local search for financial services is shifting from casual discovery to high-consideration decision-making.
Where to focus next
- Respond to every review to build trust where it matters most
- Keep listings accurate, especially services, hours, and phone numbers
- Use branch-level email and SMS to close the gap between search and action
- Watch direction clicks to spot high-intent locations and align staffing
Businesses services
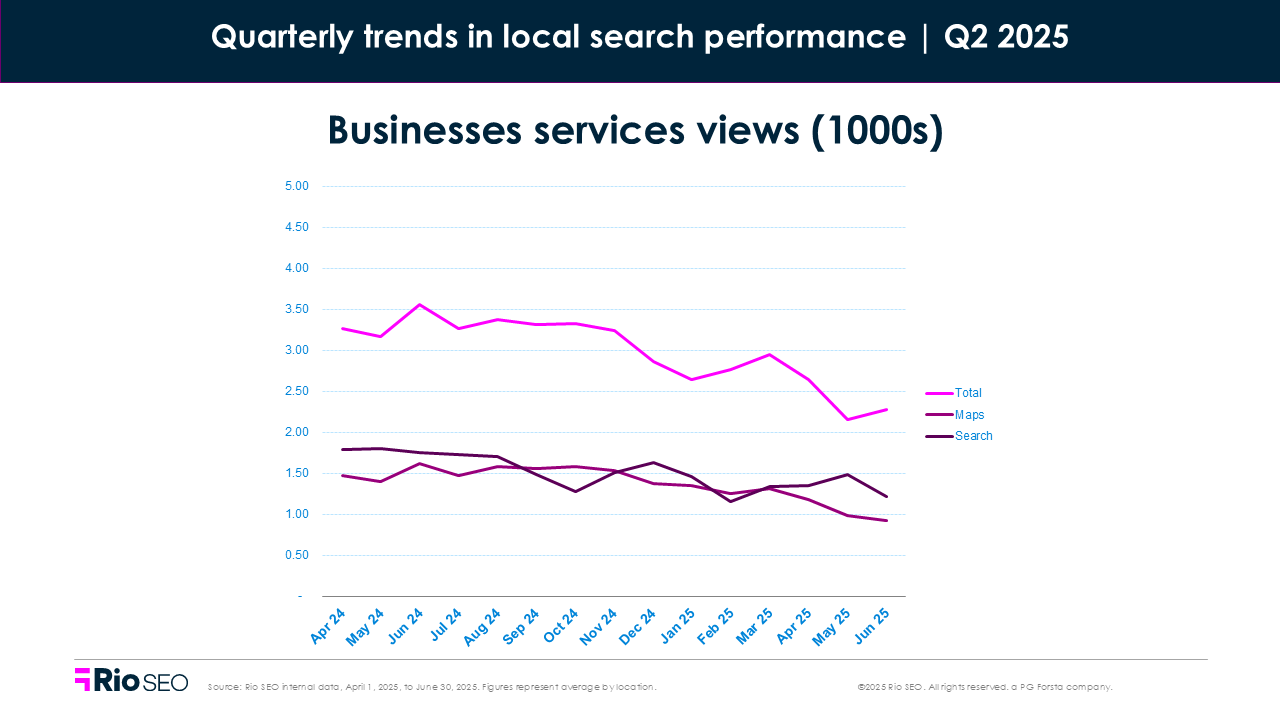
- Total Q2 2025 views: -2.1% QoQ and -30.2% YoY
- Total Q2 2025 clicks: +20.9% QoQ and +3.2% YoY
After a sharp downturn in Q1, business service brands found firmer footing in Q2. Total views were still down year over year, dropping 30.2%, but the rate of decline slowed quarter over quarter. More importantly, total clicks rebounded—up 20.9% QoQ and slightly above last year’s levels.
That signals a shift in intent, with fewer searches overall, but higher engagement when users do look.
Search views rose 2.2% QoQ, while Map views fell 7.5%. That suggests the visibility dip is tied more to SERP shifts and AI changes than user disinterest. And once users did engage, they were more likely to take action—especially via websites and direction requests.
- Website clicks jumped 30% QoQ
- Driving direction clicks rose 21.2%
- Phone calls dipped slightly, down 1.6%
These patterns reinforce what we’re seeing across verticals: discovery is becoming more selective, and customers are skipping low-relevance results in favor of trusted sources.
For business service brands—many of which rely on high-consideration actions like consultations, quote requests, or bookings—accuracy and authority are everything. If your listing isn’t up to date or backed by solid review content, it may never surface in the first place.
Where to focus next
- Prioritize review quality and response time to reinforce trust
- Keep listings fresh with current services, hours, and contact info
- Highlight high-converting branches and align campaigns accordingly
- Use website and direction click trends to track engagement hotspots
- Monitor Map vs. Search view shifts and adapt visibility strategy
Healthcare
- Total Q2 2025 views: –1.6% QoQ, +8.3% YoY
- Total Q2 2025 clicks: +2.1% QoQ, +4.3% YoY
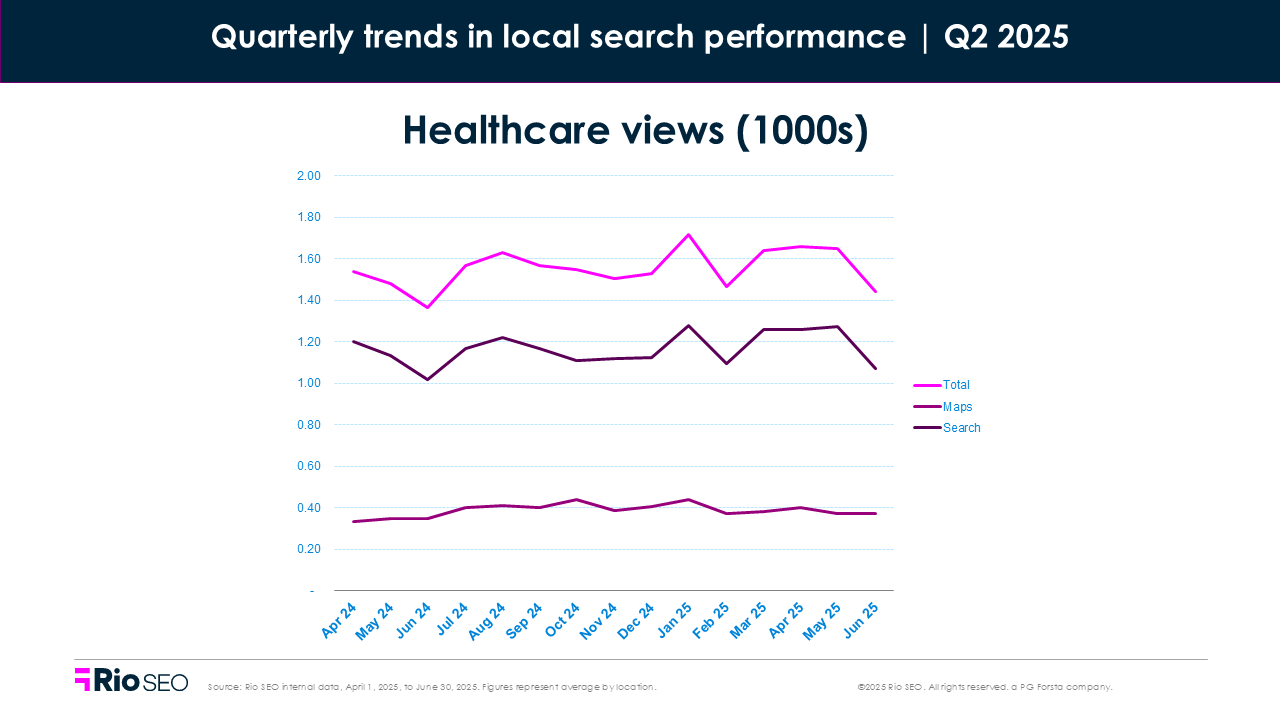
Healthcare brands held steady in Q2, with only minor shifts across metrics and signs of quiet but meaningful growth. Views dipped slightly from Q1 (–1.6%), but year-over-year visibility improved (+8.3%), making Healthcare one of the few verticals with positive annual growth.
Search impressions fell only –0.8% QoQ and remained up +7.5% YoY, suggesting that patient-driven lookups for providers or services continue to hold strong. Map views dipped –4.0%, but still show a +10.9% gain compared to Q2 last year.
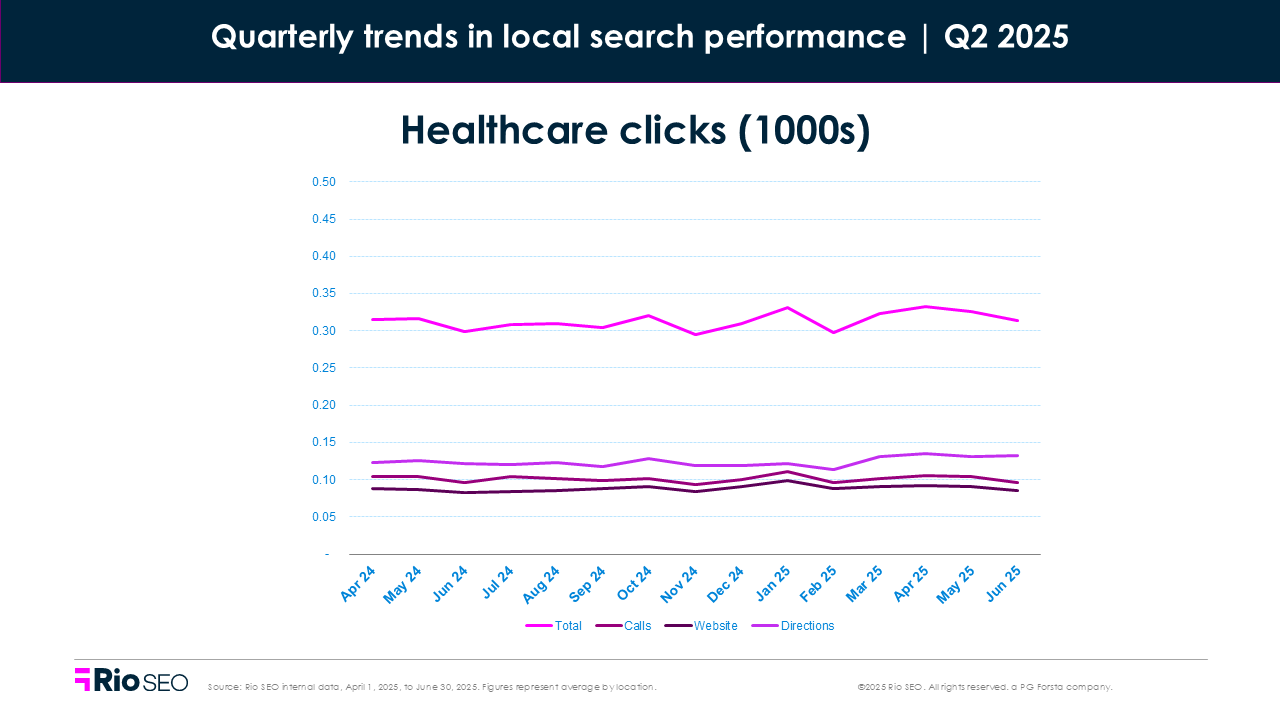
Click data paints a more encouraging picture.
Total actions rose +2.1% QoQ and +4.3% YoY — small but consistent gains. Driving direction clicks jumped nearly +9% quarter-over-quarter, reinforcing the continued importance of in-person visits in a post-telehealth plateau. Website clicks dipped slightly (–3.4% QoQ), but phone calls held steady.
One standout stat: location-based actions (like driving directions) now account for a larger share of total engagement. And with direction clicks up +7.9% YoY and conversion-focused impressions trending upward, intent is clearly there — even if volume isn’t spiking.
Where to focus next
- Keep location and service listings up to date, especially hours and provider availability
- Track direction clicks to see where in-person demand is highest
- Use reviews and FAQs to reassure patients during the search moment
- Prioritize mobile clarity; users are still calling, even if clicks dip
- Align local landing pages with health system-wide campaigns for consistency
Hospitality
- Total Q2 2025 views: +4.1% QoQ, –5.0% YoY
- Total Q2 2025 clicks: +13.8% QoQ, +3.1% YoY
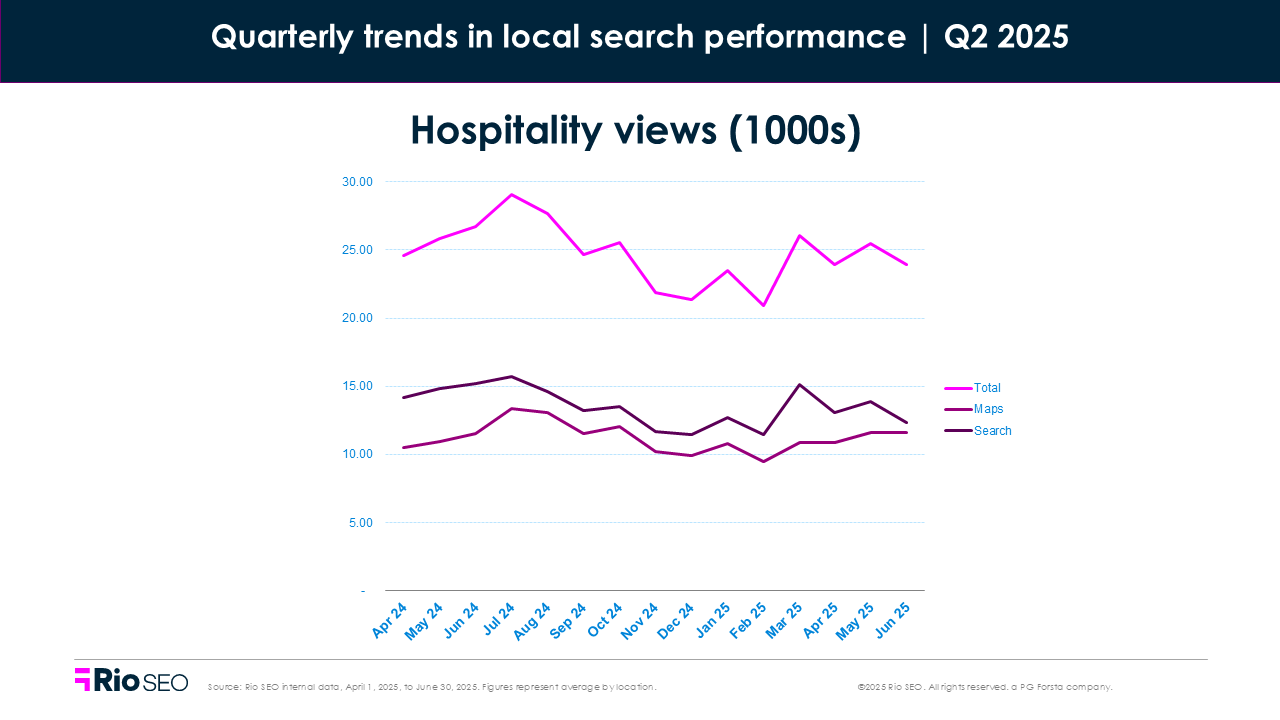
Hospitality brands continued their steady rebound in Q2. Views climbed +4.1% from Q1, led by a +9.4% jump in Map impressions, a sign that travel planning and local discovery are back on the rise. Still, total visibility remains –5.0% below Q2 2024 levels, with Search views down –11.2% YoY.
Engagement surged ahead of impressions.
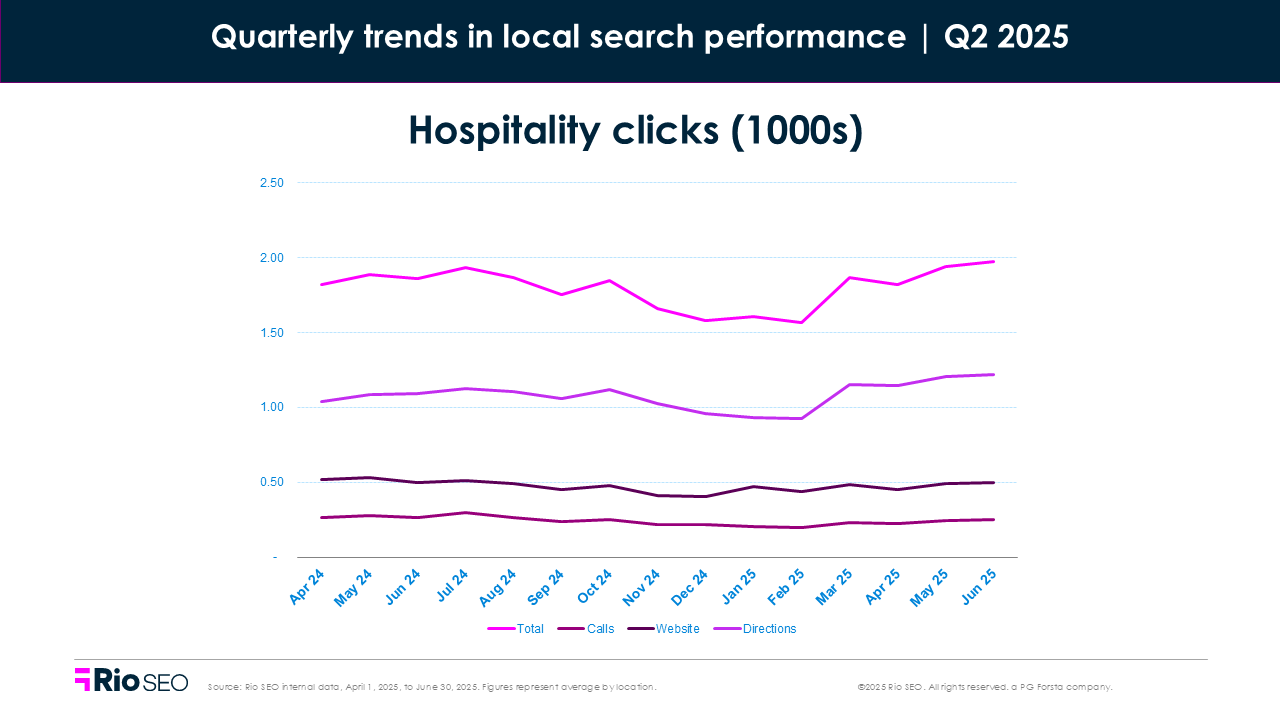
Total clicks rose +13.8% quarter-over-quarter, with direction requests up +18.6% and phone calls up +13.5%. That’s a strong signal of action-oriented intent — especially among users making last-minute decisions or navigating locally.
Website clicks saw a smaller boost (+3.7% QoQ), but the real standout was direction clicks: up +11.1% year-over-year. In a vertical where proximity drives bookings, that’s a sign people are still showing up, and listings are converting.
Where to focus next
- Optimize listings for last-mile actions: directions, hours, and click-to-call
- Add booking links and make CTAs clear and mobile-friendly
- Use direction trends to staff and promote high-performing locations
- Prioritize speed and clarity on local landing pages to reduce drop-off
- Monitor bookings closely to identify friction between click and conversion
Restaurants
- Total Q2 2025 views: –0.4% QoQ, –35.0% YoY
- Total Q2 2025 clicks: +11.1% QoQ, –5.7% YoY
- Food orders per location: –10.4% QoQ, –46.5% YoY
- Food menu clicks per location: +9.2% QoQ, –18.8% YoY
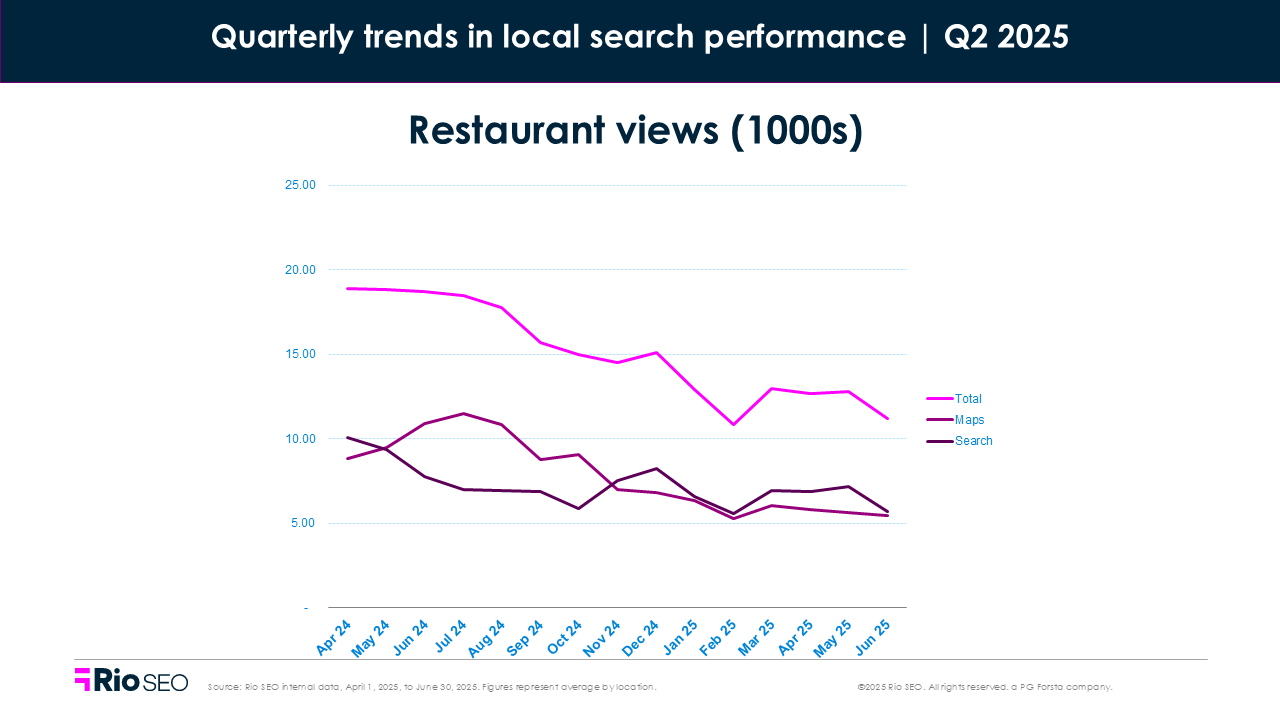
Restaurant brand visibility took another hit in Q2. Total views were essentially flat from Q1 but still down a steep –35% from last year. Maps views fell –4.4% quarter-over-quarter, while Search views climbed +3.3%, pointing to a shift in how and where diners are discovering restaurants.
Clicks were a brighter spot.
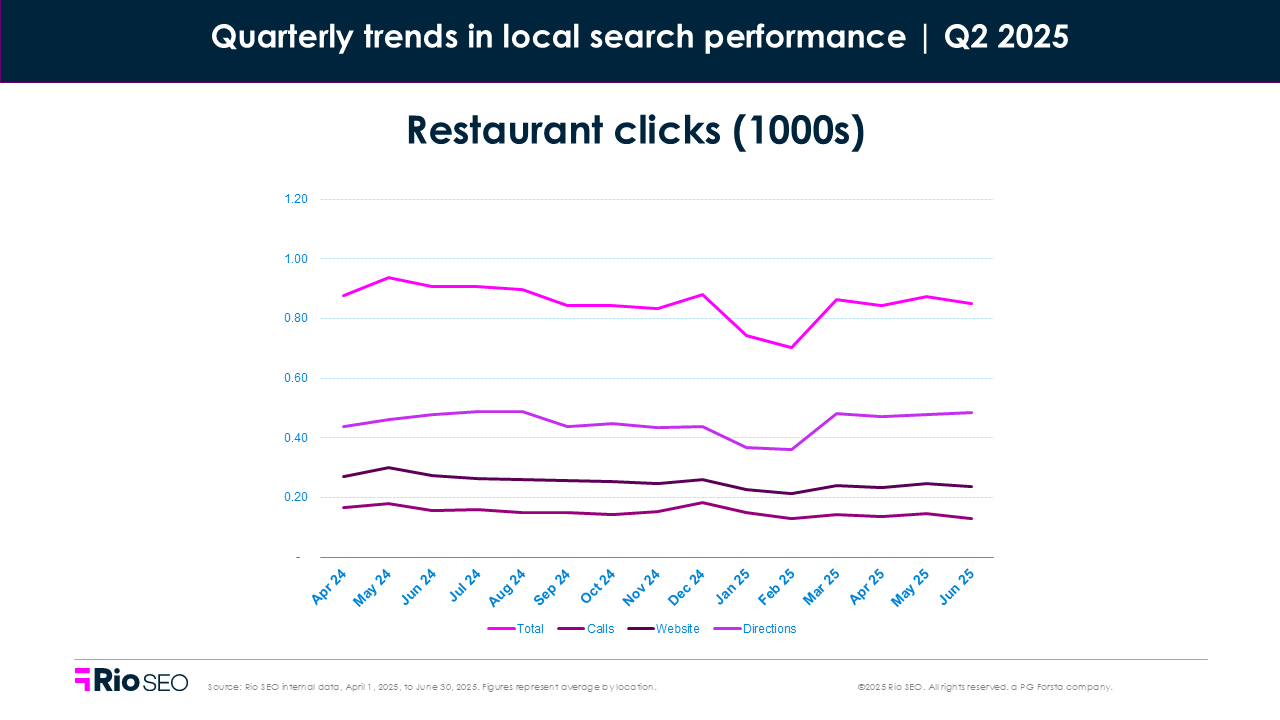
Total listing actions jumped +11.1% over Q1, driven by a nearly +19% surge in driving direction clicks. Website visits also rose +5.5%. That bump in discovery-to-decision behavior suggests that even as exposure drops, motivated diners are following through.
But phone calls slipped again, down –2.1% QoQ and –17.4% YoY — a sign that listings need to do more heavy lifting in answering diners’ questions without human help.
Meanwhile, food orders per location plunged –10.4% from Q1 and –46.5% YoY. That’s a sharp signal that interest isn’t converting. At the same time, food menu clicks rose +9.2%, suggesting more users are exploring menus — but not committing.
That growing gap between intent and action points to friction in the ordering experience, or possibly customers defecting to third-party apps. Either way, high funnel interest isn’t enough.
Where to focus next
- Audit listings for accuracy — hours, categories, and amenities matter
- Make menus easy to access and update — especially on mobile
- Use direction click data to identify high-performing locations
- Streamline food ordering paths to reduce drop-off
- Monitor reviews and respond quickly to protect trust and conversion
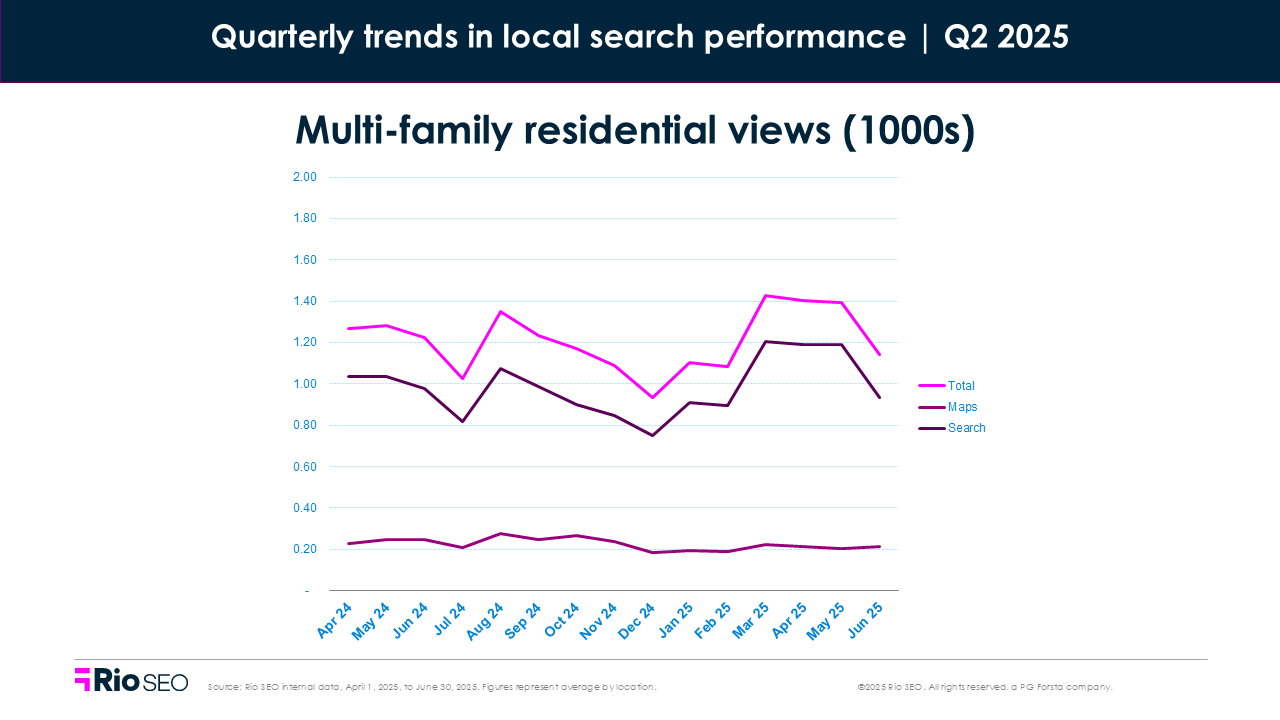
Multi-family residential
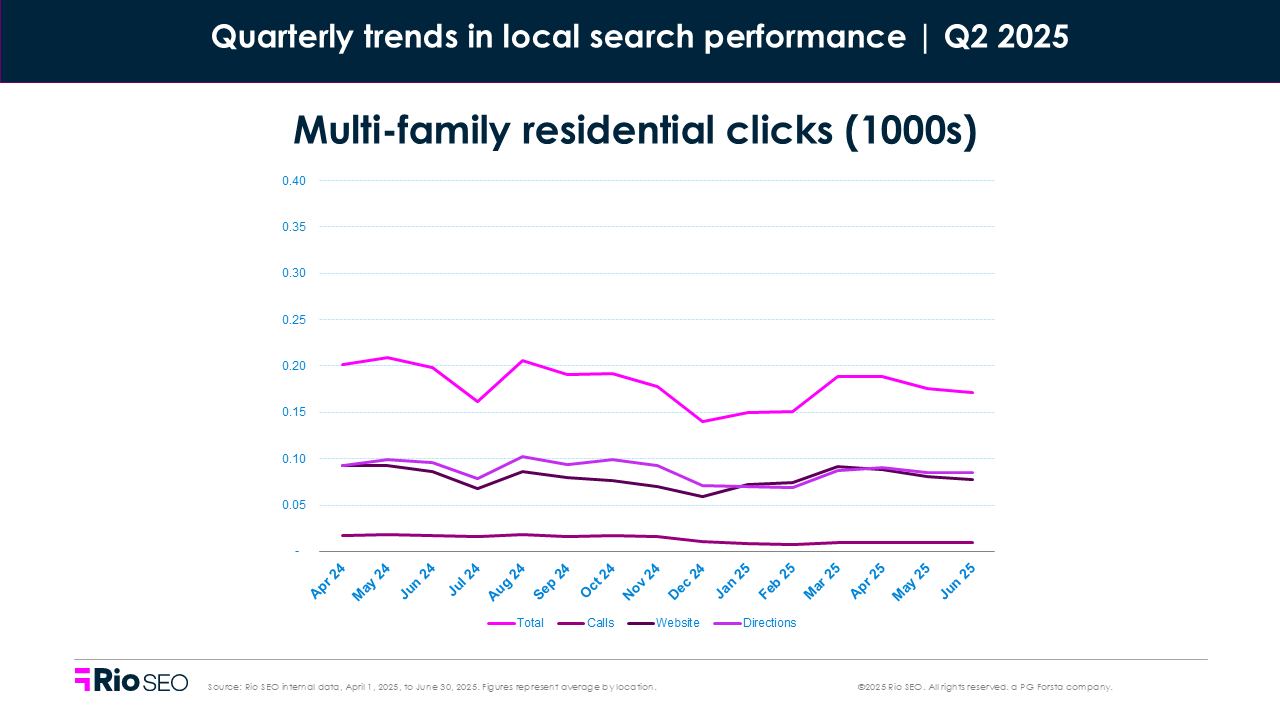
- Total Q2 2025 views: +9.0% QoQ, +4.3% YoY
- Total Q2 2025 clicks: +9.3% QoQ, –12.3% YoY
After a slow start to the year, multi-family listings gained visibility in Q2. Views rose +9.0% over Q1, with Search views up +10.0%. Compared to Q2 2024, visibility is trending slightly ahead — up +4.3% year-over-year overall.
Click activity also picked up slightly, climbing +9.3% quarter-over-quarter. But the YoY picture tells a different story: total clicks remain down –12.3% from this time last year, despite more people seeing listings.
Driving direction clicks rose +15.2% from Q1 — a sign that foot traffic and in-person interest may be rebounding. Phone calls, however, dropped further: –45.1% YoY.
Website clicks also stayed in the red, down –9.5% YoY.
That split suggests that while interest is returning, conversion remains patchy. Prospects might be turning to third-party platforms or experiencing friction on brand-owned sites.
Still, impressions in Google are improving. And with renters actively comparing options, it’s a crucial moment to close the gap between visibility and follow-through.
Where to focus next
- Refresh listings with current amenities, floor plans, and photos
- Audit phone numbers and contact paths for accuracy and ease
- Track direction clicks to align marketing with on-site activity
- Improve website UX and mobile load times to reduce bounce
- Use review responses to build trust in competitive markets
Local visibility is shifting—are you keeping up?
This quarter confirmed a growing truth: impressions are fading, but intent isn’t. Across verticals, total views are still falling, in some cases by double digits year-over-year. Yet clicks, especially high-intent actions like directions and website visits, are holding steady or rising. Consumers aren’t disappearing. They’re just taking fewer steps to act, and skipping listings that don’t meet their needs.
AI Overviews and changing SERPs are reshaping discovery. Organic links are losing space to summaries, bundles, and richer in-SERP tools. That’s shrinking the top of the funnel, and raising the stakes for every impression that does land. If your listing isn’t accurate, complete, and compelling, it won’t just get overlooked — it might not show up at all.
But when listings work, they really work. From driving direction surges in Retail and Restaurants to rising action rates in Healthcare and Business Services, one thing is clear: customers still want to connect. They’re just skipping the fluff and heading straight for the good stuff. Your listings, local pages, and reviews need to meet them there, in the moment.
The brands winning in this new reality aren’t chasing views. They’re building for action. Strong local visibility now means fewer doors, but better ones. Make sure yours is open.
Want to know where you stand? Request your free local audit to uncover hidden gaps, growth opportunities, and tips tailored to your brand.
Related resources

How Health First strengthened digital trust, improved provider visibility, and deepened patient engagement

2026 Google local search report

Answer engines and automation: What’s next for enterprise reputation
Newsletter
Get industry insights that matter, delivered direct to your inbox
We collect this information to send you free content, offers, and product updates. Visit our recently updated privacy policy for details on how we protect and manage your submitted data.