Local consumer search behavior trends in Q1 2026

Q1 marked another step toward AI-driven local discovery. As Google expands Gemini-powered experiences across Search and Maps, consumers are getting answers faster and often acting without ever clicking through.
That shift is changing the shape of local performance. In many industries this quarter, views declined while clicks held steady or increased. Search visibility softened. Maps often proved more resilient. And when consumers did engage, they showed stronger intent — researching services, requesting directions, or moving closer to purchase.
AI is part of that story. Richer listings, AI-generated summaries, and zero-click experiences are compressing the path from discovery to action. In some cases, brands may be losing measurable traffic while still influencing decisions. In others, incomplete listings may mean they’re not being surfaced at all.
The impact isn’t playing out evenly. Some industries saw demand surge; others saw visibility drop. Many saw the path to conversion change. Here’s where the quarter shifted, and what the data says to do next.
The story behind the numbers
We analyzed performance across 315,340 enterprise brand locations during a quarter shaped by overlapping Google updates and shifting search behavior.
Google confirmed three major updates in Q1:
- February 2026 Discover update (Feb. 5)
- March 2026 spam update (Mar. 24)
- March 2026 core update (Mar. 27)
We also saw outside signals of disruption. In February, Sterling Sky reported a rise in review posting blocks, with legitimate businesses seeing the message: “Posting reviews is turned off for this place.” If review volume slowed this quarter, that may be part of the reason.
At the same time, AI-driven discovery kept gaining ground. With Gemini now shaping more answers across Google Search and Maps, users are finding businesses differently, often acting without clicking.
Year-over-year local search trends
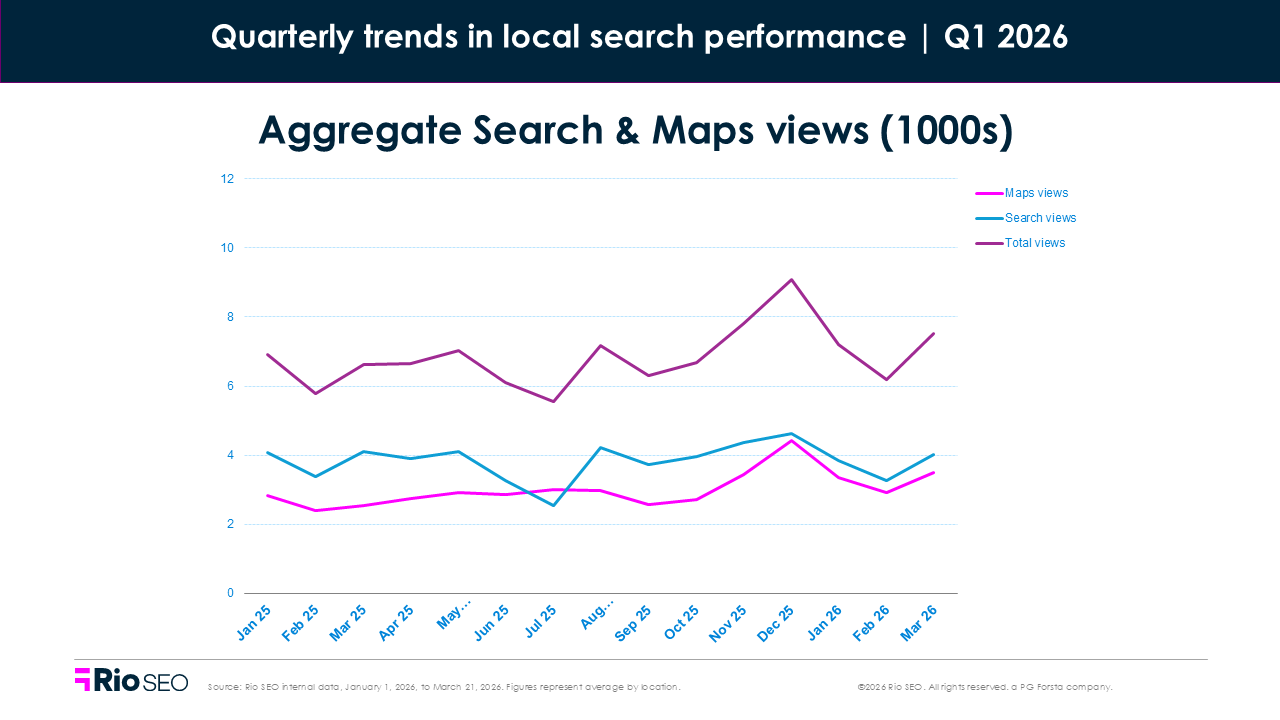
Local visibility and engagement both improved in Q1. Across Search and Maps, total views increased 8.3% year over year, while total clicks rose 7.4%.
The biggest driver was Maps, where views jumped 26.2% YoY, suggesting more consumers are discovering businesses closer to the point of decision. At the same time, Search views dipped 3.7%, which may reflect continued shifts in how Google surfaces local results and how consumers search.
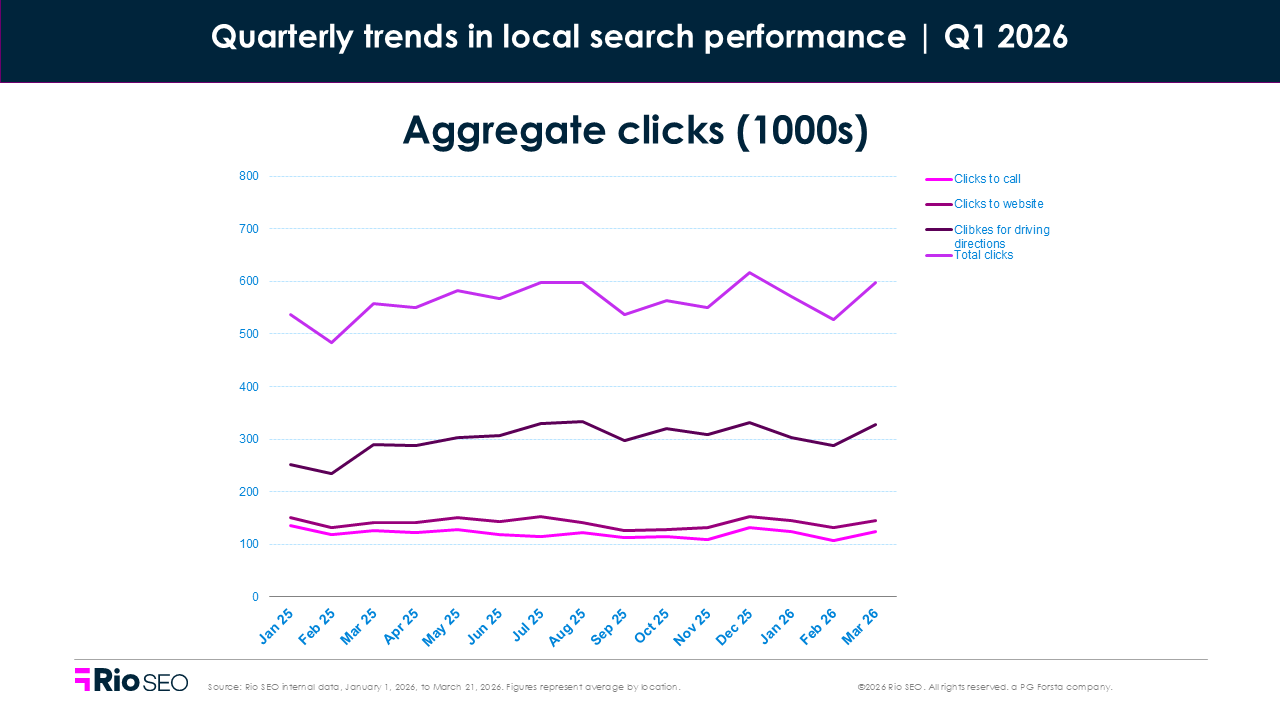
Clicks were more mixed. Website clicks were essentially flat, while driving direction requests saw strong growth. That points to high-intent users moving from discovery to in-person action. Phone calls, meanwhile, declined year over year, which aligns with reports that Google has been removing the Call button from Map Pack listings.
By click type:
- Phone calls: -6.7%
- Website clicks: +0.3%
- Driving direction requests: +14.9%
The takeaway: consumers are still engaging with local listings, but the actions they take are changing.
Quarter-over-quarter local search trends
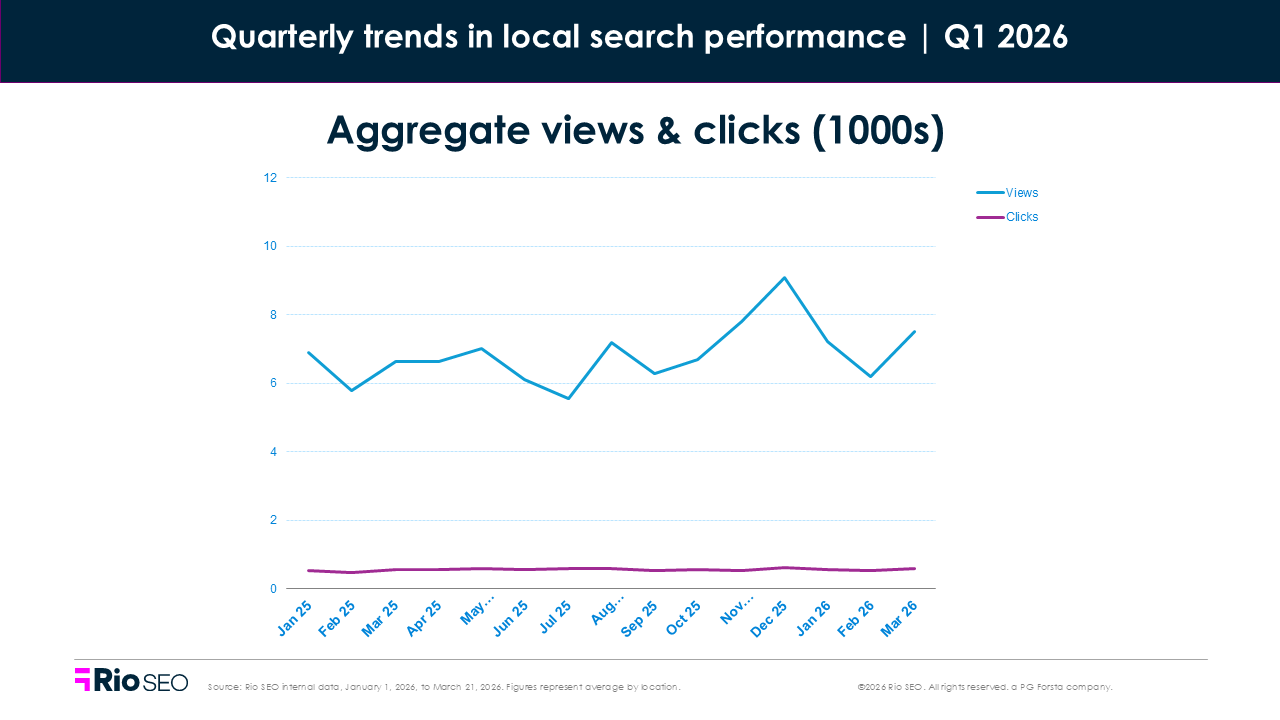
Local visibility softened in Q1. Across Search and Maps, total views declined 11.1% quarter over quarter, while total clicks dropped just 2.0%.
Even with fewer impressions, engagement held relatively steady, suggesting that the users who did find listings were still taking action.
The drop was steeper in Search. Search views fell -14.0% QoQ, while Maps views declined -7.7%, pointing to continued volatility in traditional search visibility and a more stable performance in Maps.
Clicks were more resilient. By click type, we observed:
- Phone calls: -0.4%
- Website clicks: +2.4%
- Driving direction requests: +4.6%
Consumers may be seeing fewer listings, but those who do are still engaging with intent. Let’s explore what brands are seeing in their Q1 data across industry segments.
Retail
- Total Q1 2026 views: -20.2% QoQ, +16.2% YoY
- Total Q1 2026 clicks: -8.8% QoQ, +6.3% YoY
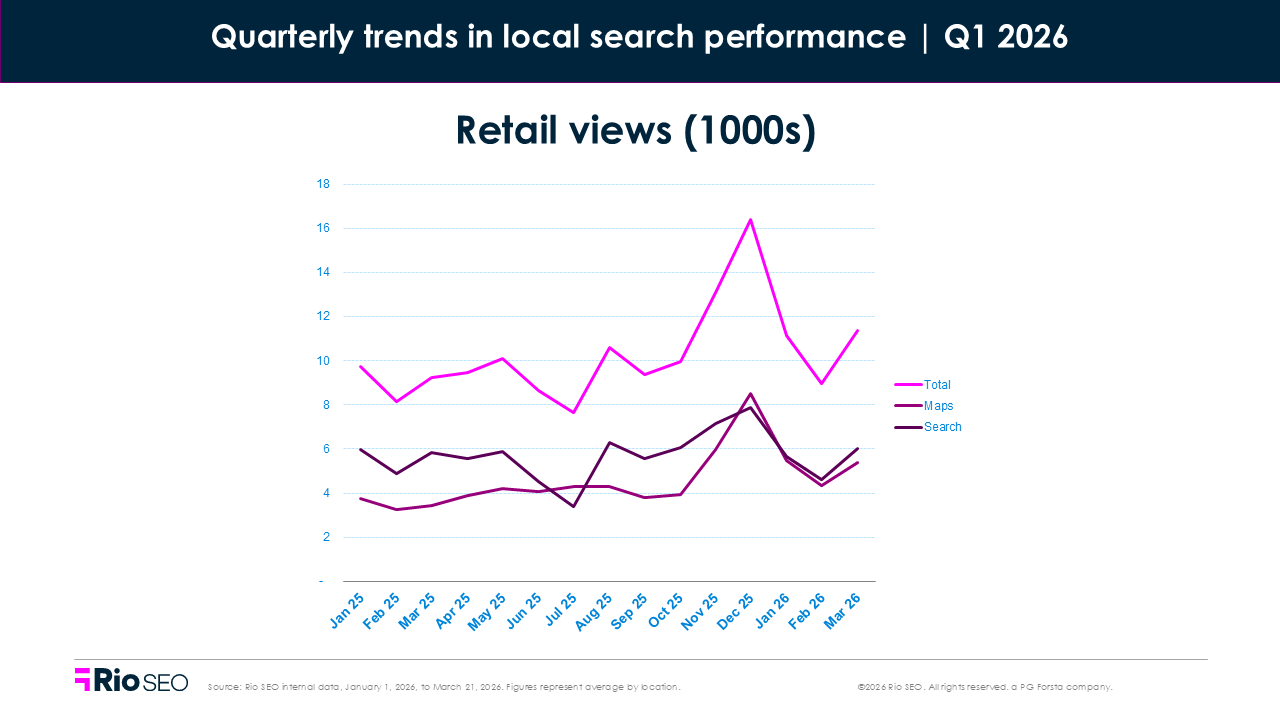
Retail visibility cooled in Q1 after the holiday surge but remained well ahead of last year with Total Views up 16.2%. This was driven by Map Views surging 45.5% YoY, while Search Views fell slightly (-2.2%), signaling that retail demand is still healthy.
That aligns with the broader industry picture. According to the U.S. Census Bureau, total U.S. retail and food services sales were up 3.7% in Q1 compared to the same period in 2025. After a slight contraction in January, retail activity accelerated through February and March, with March up 1.7% — the strongest monthly gain in more than a year.
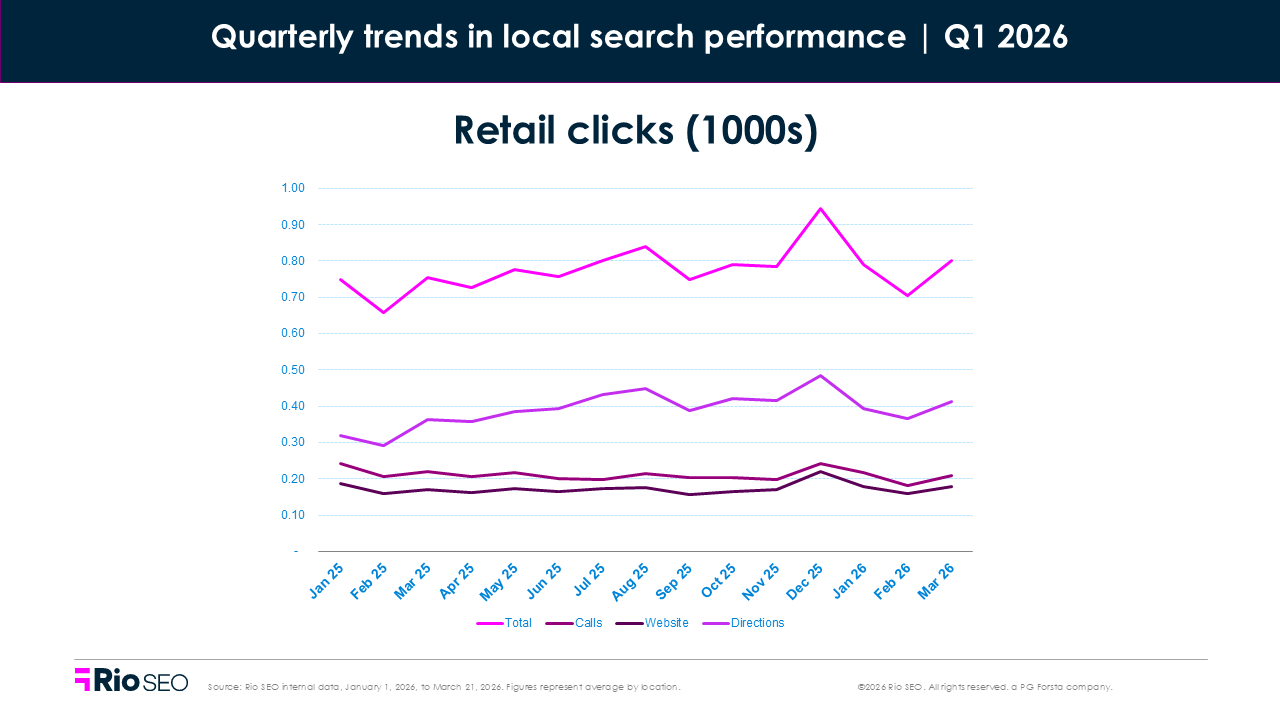
This increased online interest translated to in-store action, as Total Clicks rose 6.3% compared to Q1 2025. While Website Clicks remained flat (+0.1%) and Phone Clicks fell -8.9%, requests for driving directions grew by 19.8%.
Consumers appear to be moving faster from discovery to decision. As search engines and AI-generated summaries surface richer information upfront, shoppers may be skipping traditional research behaviors like website visits and phone calls, and heading straight in-store.
That creates a clear opportunity for enterprise brands to win the decision before the click. If shoppers are making up their minds in search and maps, brands need to treat local listings as conversion channels, not just digital storefronts.
Where to focus next
- Protect local visibility as search demand normalizes. Accurate, complete listings and fresh content matter more as competition for attention tightens.
- Use inventory, promotions, and local offers to create urgency. Timely messaging can help convert shoppers as momentum builds.
- Turn Maps into a revenue driver. With direction requests climbing, optimize for the “near me” moment with local pages, reviews, and complete profiles that push people to visit.
- Prioritize review generation and response. Fresh reviews and active responses can help reinforce trust and improve conversion when shoppers are ready to act.
Financial services
- Total Q1 2026 views: -2.6% QoQ, -9.4% YoY
- Total Q1 2026 clicks: -0.3% QoQ, +5.4% YoY
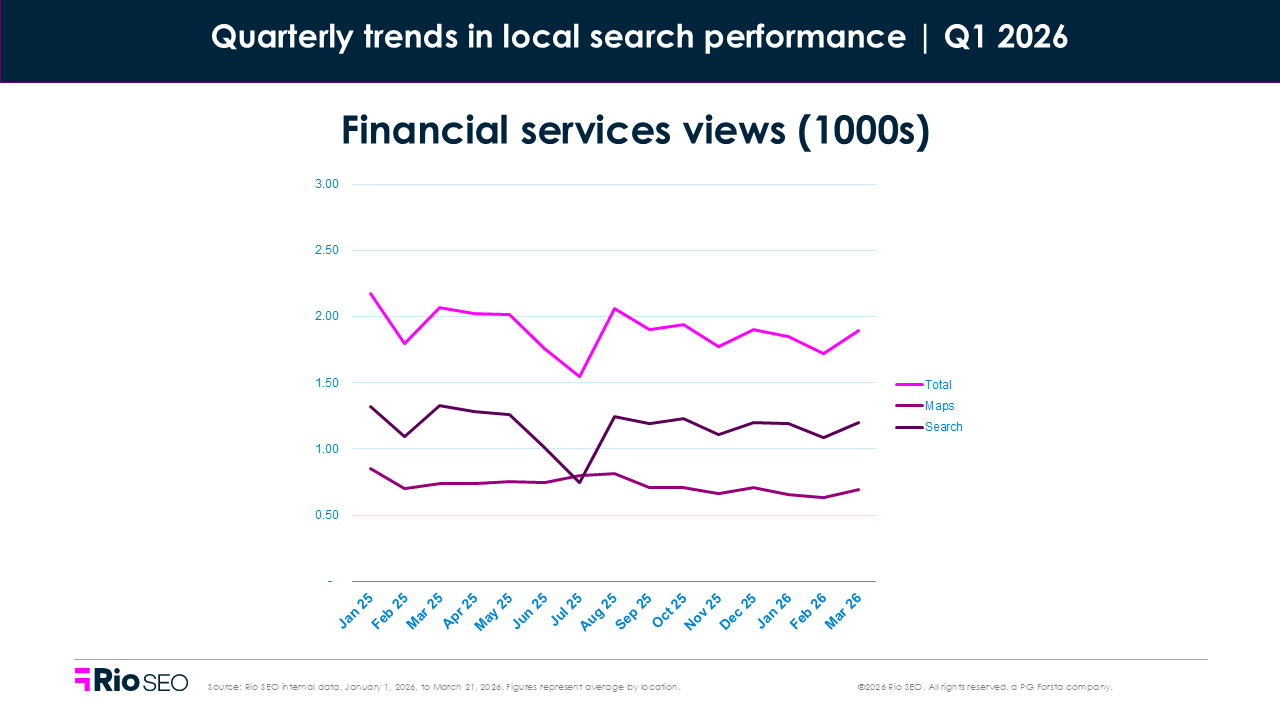
Q1 financial services visibility lagged behind the same period last year, with a -9.4% drop in Total Views driven by -13.6% fewer Maps Views and -6.8% less in Search. Local visibility is becoming more difficult to earn in an increasingly competitive and AI-influenced search environment.
Even so, customer satisfaction in the banking industry held steady in Q1, with the American Customer Satisfaction Index reporting a score of 80 out of 100. The biggest gains came in the speed of in-branch transactions and the accessibility of branch and ATM locations, pointing to convenience and ease still having great influence on consumer decision-making.
Clicks told a more resilient story, growing 5.4% over Q1 2025.
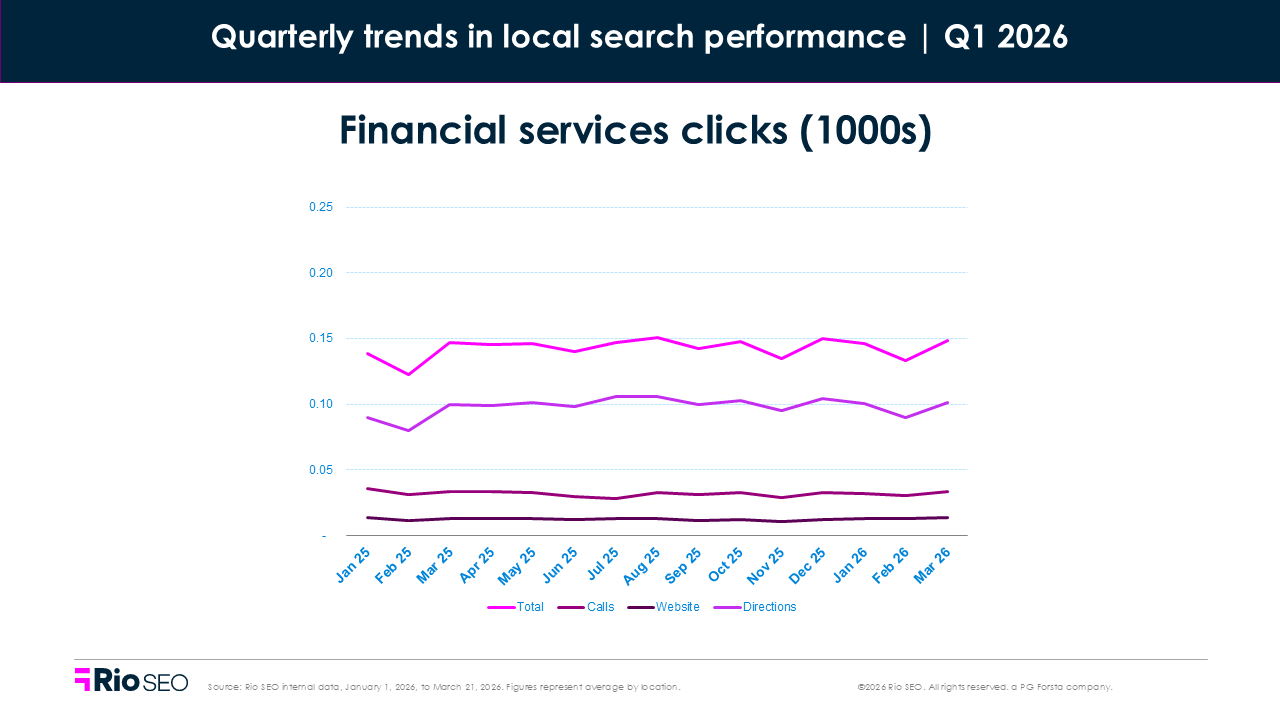
Despite that YoY drop in views, consumers are engaging local listings in financial services at a higher rate. This conversion activity is being driven by increased Website Clicks (11.1%) and Clicks for Directions (7.2%), while clicks to call a location fell slightly (-2.6%).
The rise in website clicks may reflect a broader industry trend: personalized digital experiences continue to be a major driver of retention in financial services, as customers increasingly expect seamless online tools and self-service options.
Consumers may also be spending less time browsing and more time evaluating. As trust, transparency, and convenience become more important in financial services, listings that quickly surface the right information may be more likely to convert.
Where to focus next
- Strengthen digital conversion paths. With website clicks rising sharply, ensure local pages and branch-level landing pages make it easy for consumers to research services and take the next step.
- Audit branch-level listing accuracy. In a trust-sensitive category like financial services, inaccurate hours, outdated services, or inconsistent data can quickly cost conversions.
- Highlight key services and specialties in Google Business Profiles. Consumers evaluating providers in search need immediate clarity on offerings like mortgages, wealth management, business banking, or lending.
- Monitor shifts between Maps and Search. Search held steadier this quarter, which may signal changing discovery behavior and the need to prioritize visibility across both surfaces.
- Prioritize reviews and reputation management. Trust is critical in financial services, and fresh reviews with active responses can reinforce credibility at the moment of decision.
Service businesses
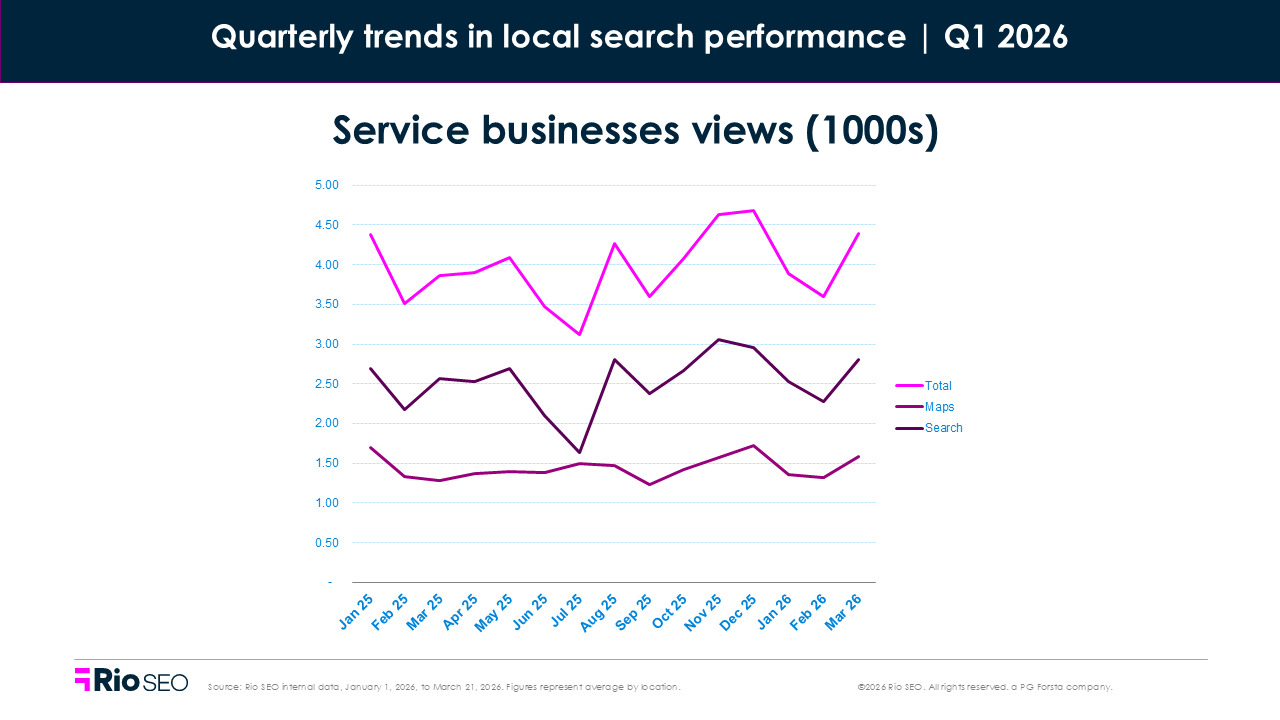
- Total Q1 2026 views: -11.2% QoQ, +1.0% YoY
- Total Q1 2026 clicks: +2.2% QoQ, +10% YoY
Service businesses saw location visibility online stagnate in Q1. Map (-9.2%) and Search (-12.3%) views both declined quarter-over-quarter, reflecting softer discovery activity after the holiday season. Compared to the year prior, a 2.3% gain in year-over-year Search Views offset by a -1.2% drop in Maps Views left the segment ended up just a single percentage point ahead of Total Views in Q1 2025.
Clicks came out stronger.
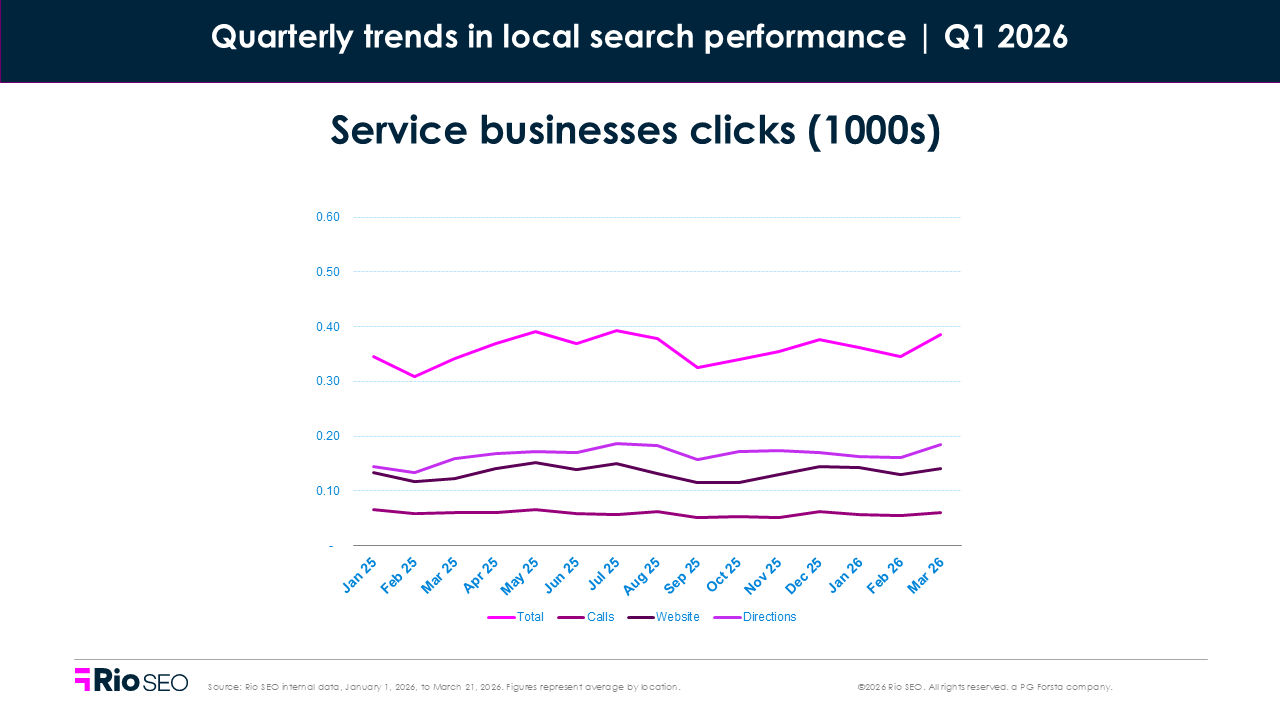
Total clicks rose 2.2% QoQ and climbed 10.0% YoY, indicating that consumers who did view those listings online were more intent-driven.
Annual conversion growth was driven by Clicks for Directions (+16.3%) and Website Clicks (+10.6%); only Clicks to Call fell, by -6.2%.
Consumers may be searching less often, but with greater intent when they do. Rising Website Clicks and Direction Requests suggest service-based brands are successfully capturing both online consideration and in-person action, while declining Calls point to a growing preference for self-service and richer in-search experiences.
For service businesses — from gyms and salons to post offices, pet care, and auto shops — complete listings and clear calls to action can still convert fewer impressions into stronger engagement.
Where to focus next
- Keep listings accurate and complete across every location. For service businesses, details like hours, services offered, booking availability, and contact information directly influence conversions.
- Strengthen digital conversion paths. With website clicks rising, make it easy for customers to book appointments, check availability, or learn more without friction.
- Optimize for high-intent actions. Phone calls and website visits increased this quarter, so ensure “Call now,” “Book now,” and service-specific CTAs are easy to find.
- Refresh photos and business descriptions regularly. In competitive service categories, visual trust signals and clear service information can improve conversion.
- Monitor location-level engagement trends. Service demand can vary widely by market, making local reporting critical for spotting opportunities and declines early.
Healthcare
- Total Q1 2026 views: +2.5% QoQ, +2.9% YoY
- Total Q1 2026 clicks: +5.9% QoQ, +3.0% YoY
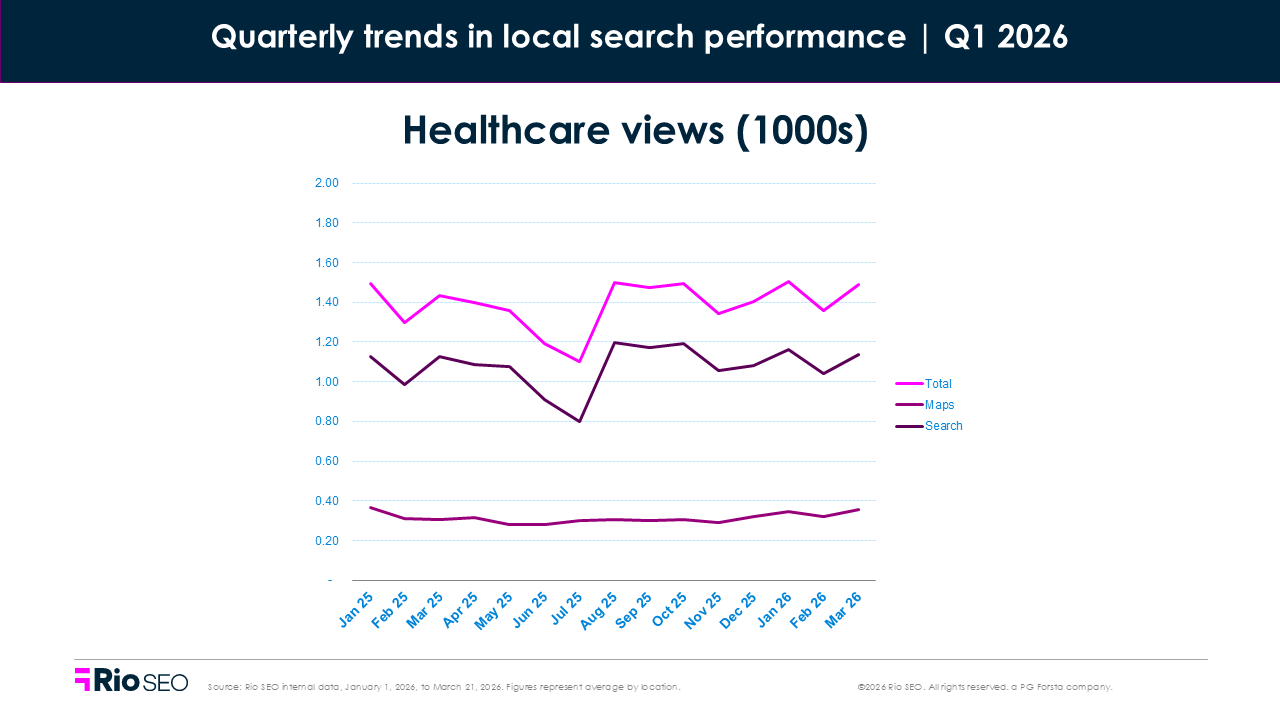
Healthcare visibility and engagement both improved in Q1. Map (+11.1%) and Search (+0.2%) views rose over Q4, with Maps driving nearly all of the growth. That suggests more patients are turning to map-based discovery when searching for nearby care, urgent services, or in-person appointments.
Year-over-year figures show greater Views (+2.9%) and Clicks (+3%) when compared to Q1 2025, though digging deeper into types of clicks reveals an interesting trend.
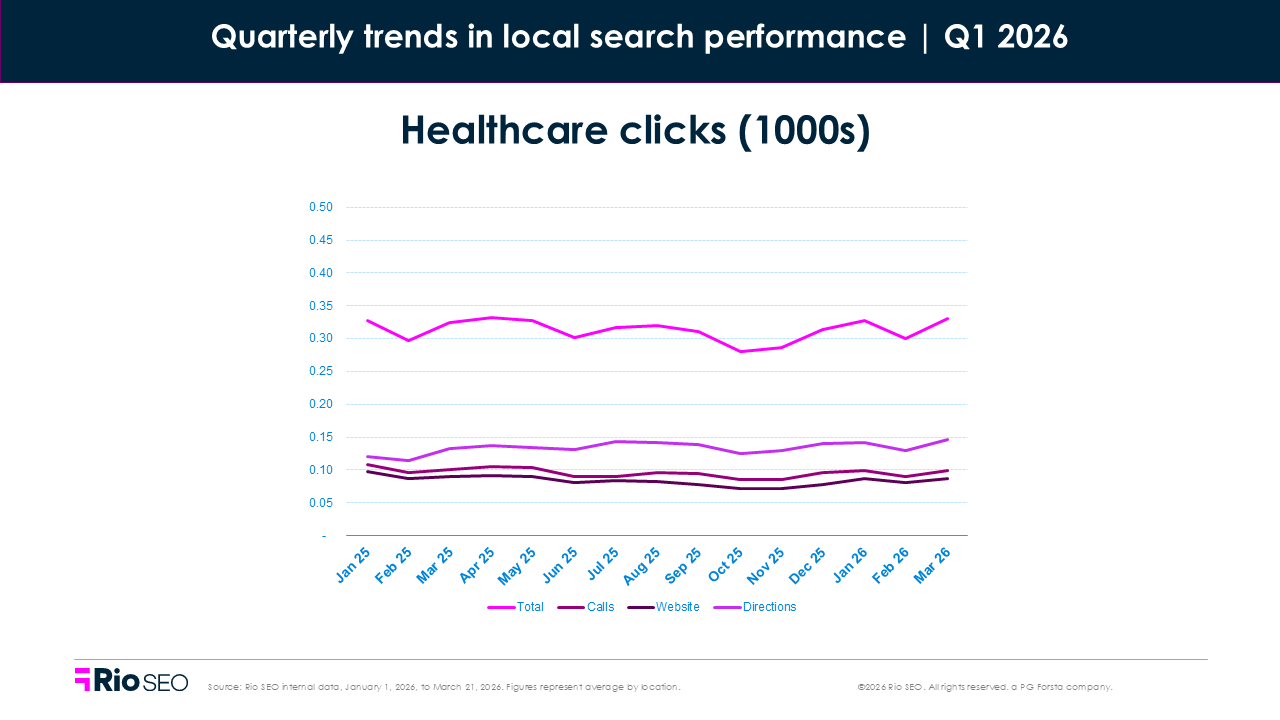
Both Phone and Website Clicks dropped YoY, by -4.5% and -5.4%, respectively. Conversion gains are being driven by the +15.1% increase in requests for driving directions.
Healthcare searches are often immediate and practical. People may care less about browsing and more about finding the closest available option, and yet trust signals are essential in healthcare. When local consumers don’t need to visit the website or call a location, it suggests that reviews, provider details, photos, accessibility info, and accurate categories may now be enough to drive a decision without requiring extra validation.
That aligns with broader industry trends. A 2026 practice-focused analysis of patient expectations found that online self-service channels (including portals, websites, and mobile apps) ranked as the #1 preferred booking method at 42%, ahead of telephone booking at 33%. Within that, 60% of patients listed the patient portal among their top three preferred ways to book, even though many still default to phone because they can’t easily find the digital option.
Patients are still actively searching for care, but increasingly expect immediate access to information and frictionless booking options. Listings that make the next step easy are more likely to convert.
Where to focus next
- Build trust signals with a solid reputation management strategy. It’s not enough to hope patients leave good reviews. Soliciting patient feedback and responding to all reviews helps show searchers the organization is trustworthy, caring, and involved.
- Prioritize online booking. With website clicks rising sharply, make appointment scheduling fast, mobile-friendly, and easy to access from local listings and local pages.
- Keep provider and service information accurate. Patients rely on listings for hours, specialties, accepted insurance, and urgent care availability.
- Optimize for map-based discovery. With Maps driving most of the visibility gains this quarter, complete and accurate Google Business Profiles are critical.
- Highlight high-demand services and specialties. Use local pages and listings to surface urgent care, primary care, diagnostics, and specialty services clearly.
- Monitor patient engagement by location. Local reporting can help identify markets where appointment demand is rising or where friction may be limiting conversions.
Hospitality
- Total Q1 2026 views: +7.2% QoQ, -10% YoY
- Total Q1 2026 clicks: -0.6% QoQ, +4.7% YoY
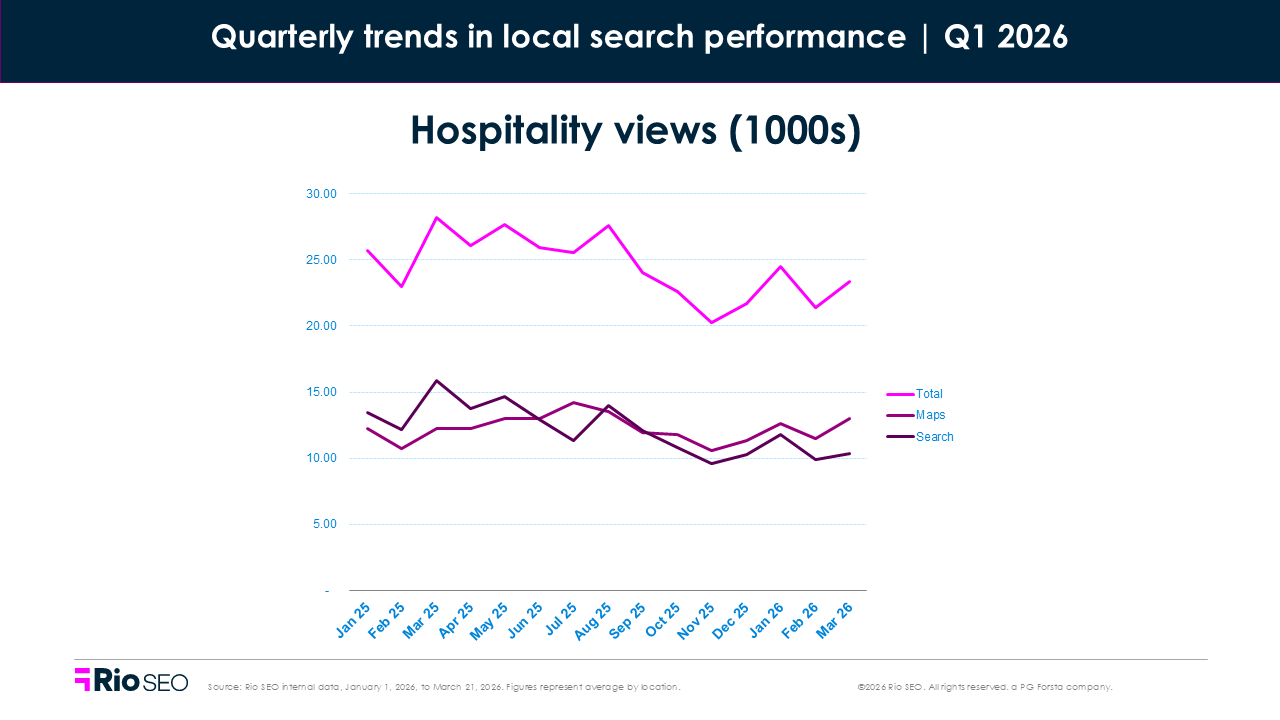
Hospitality visibility improved over Q4 2025, though performance lagged behind last year, as we see Total Views are down -10% YoY. Search Views fell noticeably (-22.9%), and a modest +5.9% gain in Maps Views couldn’t make up the difference.
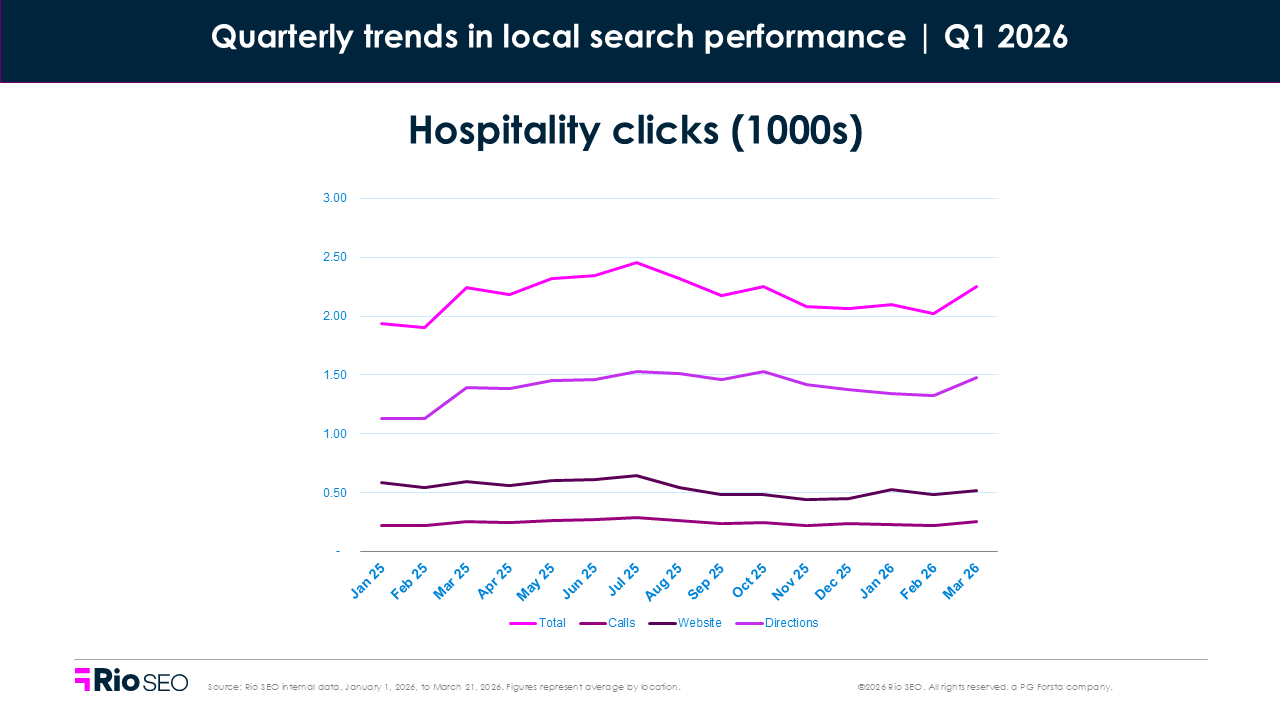
Despite this loss in visibility, the hospitality brands we track saw Total Clicks increase 4.7% over Q1 2025. The greatest gain came from Clicks for Directions, which rose 13.4% YoY. This indicates those consumers still searching did so with greater intent and found what they needed — maybe in local listings, or perhaps via an AI assistant — to make the decision to head to a location. Clicks to Website rose 10.7%, while Clicks to Call remained flat.
That aligns with broader industry trends. National RevPAR (revenue per available room) rose roughly 3.6% YoY in Q1 2026, driven by slightly higher occupancy and stronger room rates. At the same time, Marcus & Millichap projects hotel supply growth will accelerate to about 2.6% in 2026, especially in the upscale and mid-scale segments, which could put upward pressure on vacancy rates as competition intensifies.
Rich listings, compelling photos, and seamless booking experiences remain critical for conversion.
Where to focus next
- Prioritize booking-ready local listings. With website clicks rising, make pricing, amenities, and “Book now” calls to action easy to find.
- Refresh visual content frequently. Photos and updated property details help travelers compare quickly and build trust faster.
- Strengthen Google and Apple Maps visibility. This means beefing up on-page content, review content, and responses, all of which feed the AI system Maps uses to recommend hotels in response to AI queries.
- Monitor market-level competition closely. As supply grows in upscale and mid-scale segments, local reporting can help identify markets where visibility or engagement is slipping.
Prioritize reputation management. Reviews remain one of the strongest decision-making signals in hospitality, especially as travelers compare options more carefully.
Restaurants
- Total Q1 2026 views: +51.9% QoQ, +25% YoY
- Total Q1 2026 clicks: +49.6% QoQ, +3.7% YoY
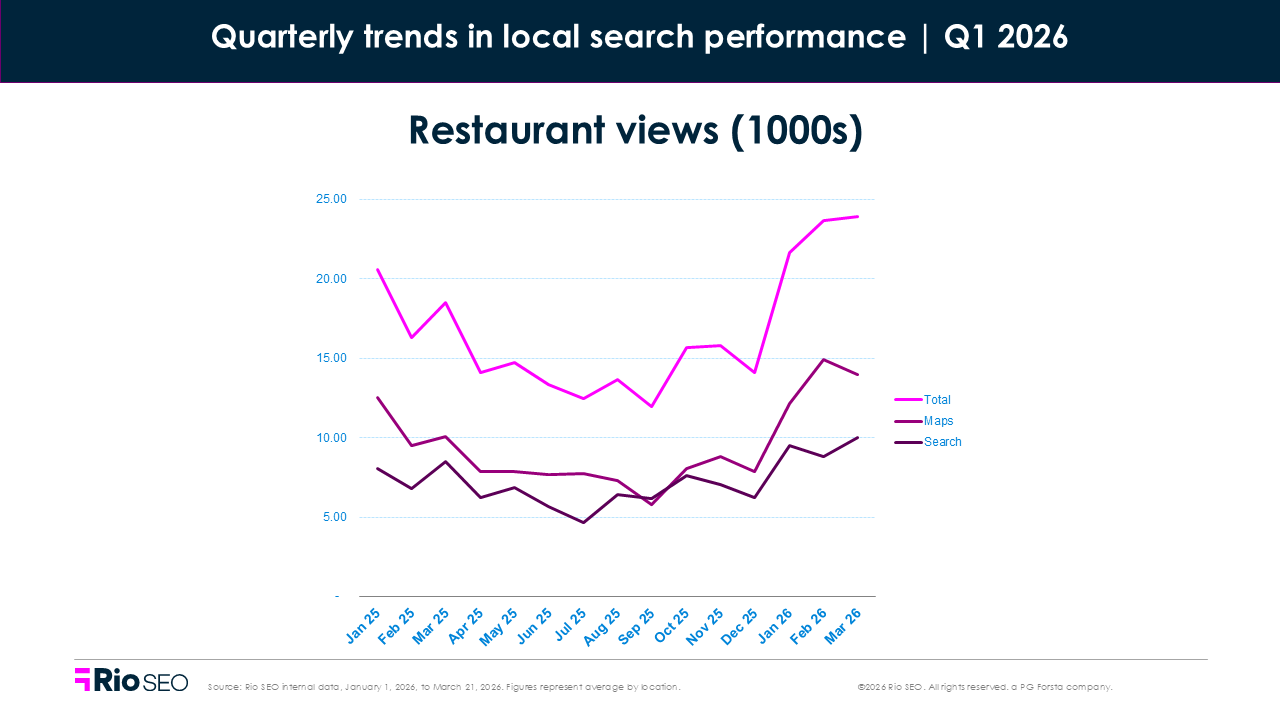
People are hungry, and they’re going online to explore their options. Search visibility rose dramatically for the Restaurants segment this quarter, with a 51.9% increase in QoQ landing Total Views 25% higher than in Q1 2025. Restaurant brands are gaining visibility across both key local discovery channels — Maps for high-intent, in-the-moment dining decisions (+27.7%), and Search for broader discovery like cuisine, menu, or branded queries (+21.3%).
Big picture, U.S. quick-service restaurants (QSR) saw net sales rise 2.1% YoY, rebounding from Q4 declines as brands stabilized pricing and menu mix. Full-service restaurants (FSR), meanwhile, faced more pressure, with visits down roughly 1.4% YoY, including a nearly 2% decline on weekends—traditionally a peak period.
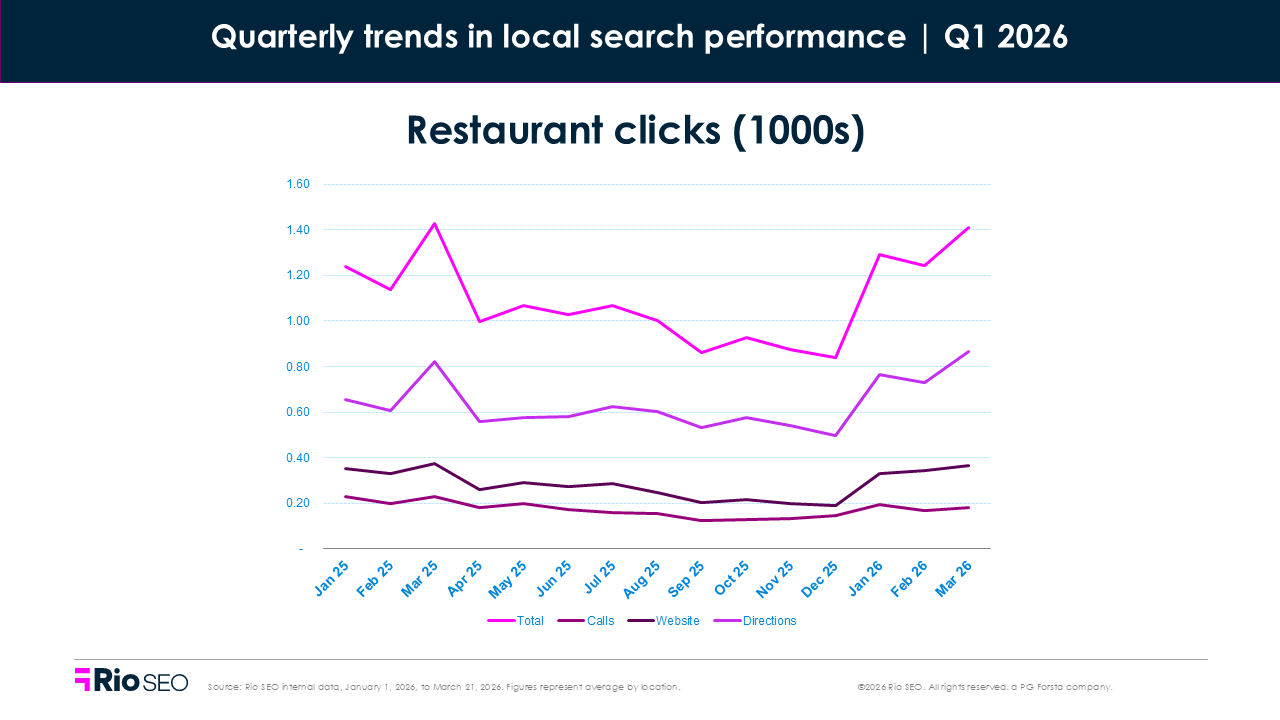
Restaurant demand is rising, but the path to conversion may be shifting. Diners are comparing menus, checking pricing, and making faster decisions across both on-site and off-site channels. Total clicks jumped 49.6% QoQ and rose 3.7% YoY, indicating that stronger visibility translated into action, though to a lesser extent.
Where to focus next
- Use local campaigns and promotions to drive higher average checks and smooth demand during weekdays or off-peak periods.
- Optimize on-page, local listing, and reviews content for specific services and amenities. AI assistants and their underlying LLM systems are processing longer, more conversational queries from customers who are not only looking for a type of cuisine, but “Which restaurant along this route has high chairs?” or “Where can we stop for lunch that has accessible parking and washrooms?”
- Keep menus accurate and up to date. With menu clicks rising sharply, outdated pricing or missing items can create friction and cost conversions.
- Strengthen local reputation management. Reviews, photos, and timely responses help diners choose quickly when comparing multiple nearby options.
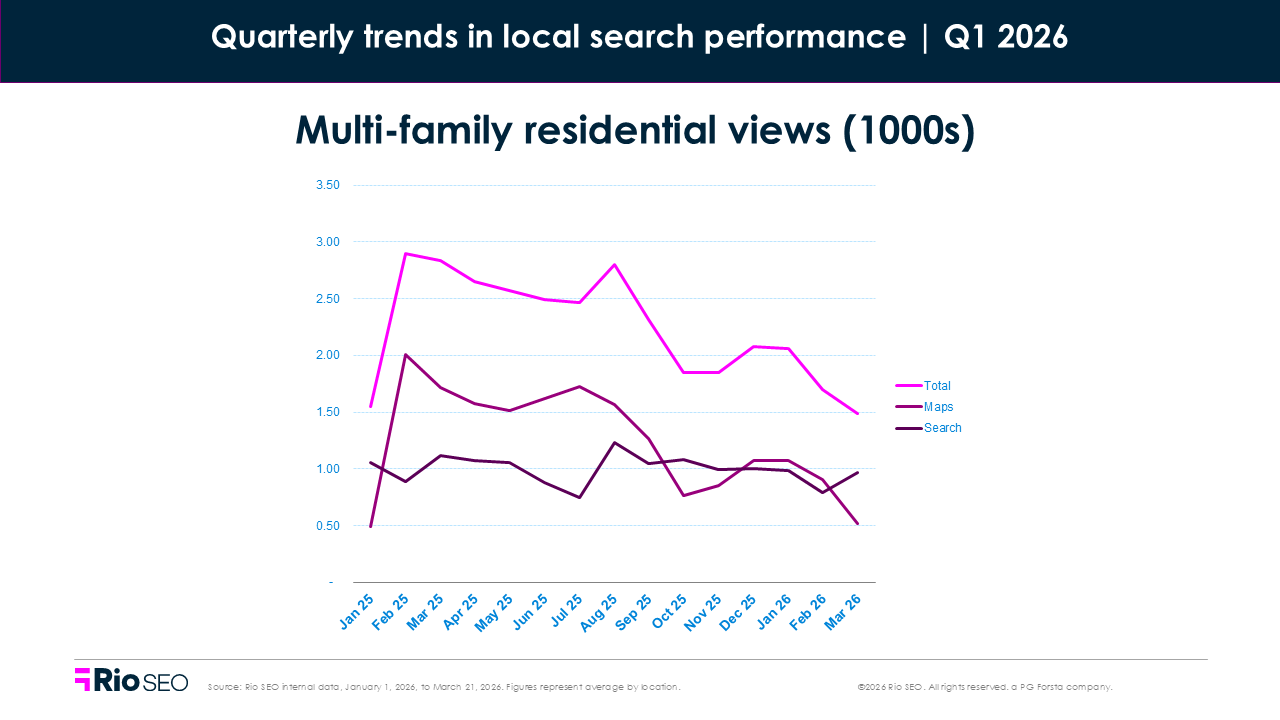
Multi-family residential
- Total Q1 2026 views: -9.3% QoQ, -28.5% YoY
- Total Q1 2026 clicks: +7.6% QoQ, +10.8% YoY
The U.S. apartment market is stabilizing, but still soft. Occupancy reached 94.9% in Q1 2026, up slightly from Q4, though still below year-ago levels. Demand has improved, with roughly 93,300 units absorbed in Q1 — one of the strongest first quarters in the past decade but annual demand remains slightly below the long-term average.
But while demand may be improving, digital discovery is still lagging.
Map (-7.7%) and Search (-10.8%) views both declined QoQ, continuing the downward trend in local discovery for multi-family residential brands. Total search views landed -28.5% lower than the same period one year prior.
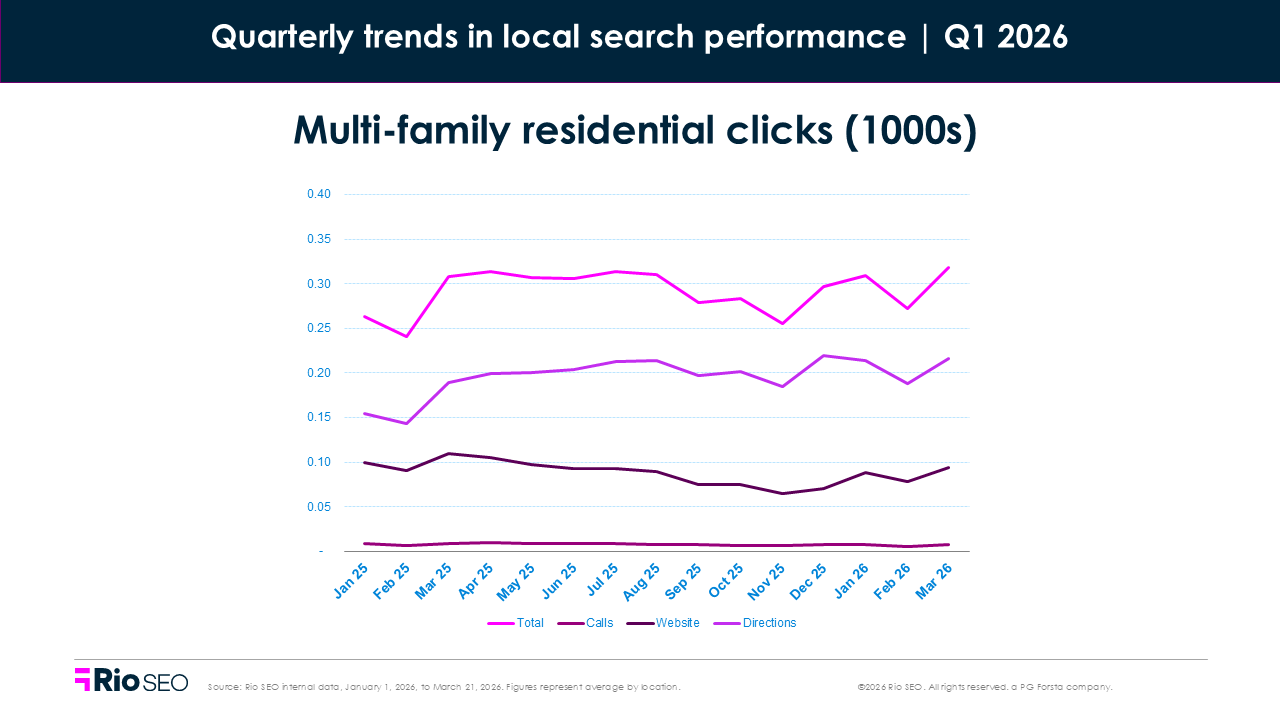
Clicks told a more encouraging story. Total clicks rose 7.6% quarterly and 10.8% YoY, indicating that while fewer renters are discovering listings, the ones who do are further down the funnel.
While Clicks to Call and Website Clicks dropped — -14.3% and -12.8% respectively — Clicks for Directions grew 26.6%, indicating that a growing proportion of searchers are finding what they need and are ready to take action. In a softer market, renters may also be pre-qualifying properties through third-party sites, social, or aggregator platforms before engaging directly.
This could also indicate an increase in self-guided tours, in-person leasing visits, and drive-by evaluations of neighborhoods and curb appeal.
Where to focus next
- Protect search visibility where demand is softening. With Search views down more than 10% this quarter and nearly 30% year over year, complete, optimized listings are critical to staying discoverable.
- Turn website visits into leases. Website clicks surged 24.7%, so property pages should surface pricing, availability, floor plans, and tour scheduling immediately.
- Prioritize occupancy-driving content. In a market focused on retention and occupancy over rent growth, spotlight move-in specials, concessions, and high-value amenities in listings and local pages.
- Track high-intent properties and markets. Rising clicks alongside falling views suggests some locations are outperforming. Use location-level reporting to identify where demand is strongest and where intervention is needed.
- Reduce friction in the tour-to-lease journey. Driving direction requests rose modestly, signaling continued in-person interest. Make scheduling tours and contacting leasing teams as seamless as possible.
Conclusion
The Q1 data tells a clear story: local search is changing fast. AI is shrinking the path from discovery to decision, even as search is getting less predictable. And visibility alone means less than it used to. Brands that win will keep their local presence accurate, complete, and ready to convert across every location.
Want to know where you stand? Request a local audit to uncover hidden gaps, growth opportunities, and tips tailored to your brand.
Related resources

Leading mobility company turns reputation management into a powerful acquisition and revenue driver

evo: Turning reputation into a growth engine
Solotel: Using guest feedback to drive visibility, engagement, and better decisions
Newsletter
Get industry insights that matter, delivered direct to your inbox
We collect this information to send you free content, offers, and product updates. Visit our recently updated privacy policy for details on how we protect and manage your submitted data.