Local consumer search behavior trends in Q4 2025

The fourth quarter of 2025 confirmed a pattern we’ve seen building all year. Local visibility is harder to earn, but consumer intent remains strong. Brands that win are those with accurate, action-ready listings and experiences designed for AI-driven, often zero-click discovery.
If it felt harder to stay visible in Q4, you weren’t imagining it. Holiday demand was high, but so was disruption, with multiple major Google updates, shifting search layouts, and the growing influence of AI all changing how customers found and engaged with local businesses.
When discovery habits shift, so do expectations. And when it comes to local experience (LX), what worked last quarter might not work now.
The good news is that you’re not navigating it alone. Each quarter, we analyze performance across more than 228,000 enterprise brand locations across eight industries to surface what’s changing, what’s working, and where to focus next.
This Q4 2025 report distills those insights to help you meet customers where they are, protect performance through volatility, and stay competitive as 2026 begins.
The story behind the numbers
Q4 brought its usual seasonal surge of holiday shoppers, and this year, brands had to contend with a confirmed Google core update in December and smaller updates in October and November. Each introduced noticeable volatility, especially in local visibility, peaking just ahead of the holidays and reshaping how (and where) businesses showed up in search.
At the same time, search behavior has continued to shift. Our most recent consumer behavior survey found that 84% of consumers are searching online daily for local businesses, and 60% say they click on AI-generated overviews in Google Search. Discovery is still happening, but not always where or how it used to.
Let’s take a look at the overarching trends from Q4, then dig into the industry-specific insights to help contextualize your local performance.
Year-over-year local search trends
On average, brands saw a clear drop in local search visibility in Q4 2025, with aggregate total views down 13.2% year-over-year across both Maps and Search, though there were variations by industry. The decline was evenly split — Maps views fell 13.0%, and Search views dropped 13.4% — reflecting both increased competition for attention and changes in how Google surfaces results.
Despite fewer impressions, engagement held relatively steady. Total clicks dipped only 1.8% YoY, a sign that users who do find you are more likely to act. Breakdown by click type shows the same shift:
- Phone calls: –12.9%
- Website clicks: –7.7%
- Driving direction requests: +6.4%
That rise in direction clicks suggests shoppers are moving with intent, especially around high-traffic holidays. Conversion opportunities remain strong for brands that show up with accurate, action-ready listings.
Quarter-over-quarter local search trends
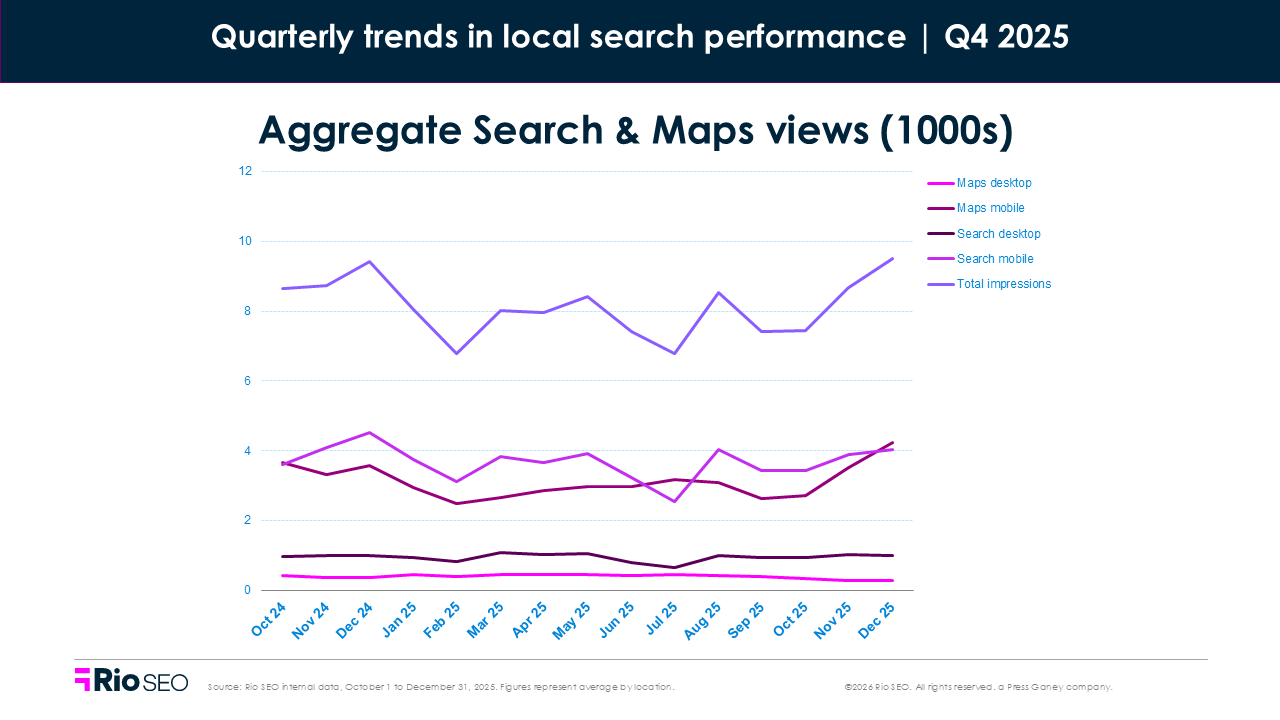
Local visibility rebounded in Q4, with total views up 12.5% across both Maps and Search. Maps views rose 11.2%, while Search views climbed 13.5%, likely driven by increased consumer activity around the holidays and recovery from Q3’s reporting disruptions.
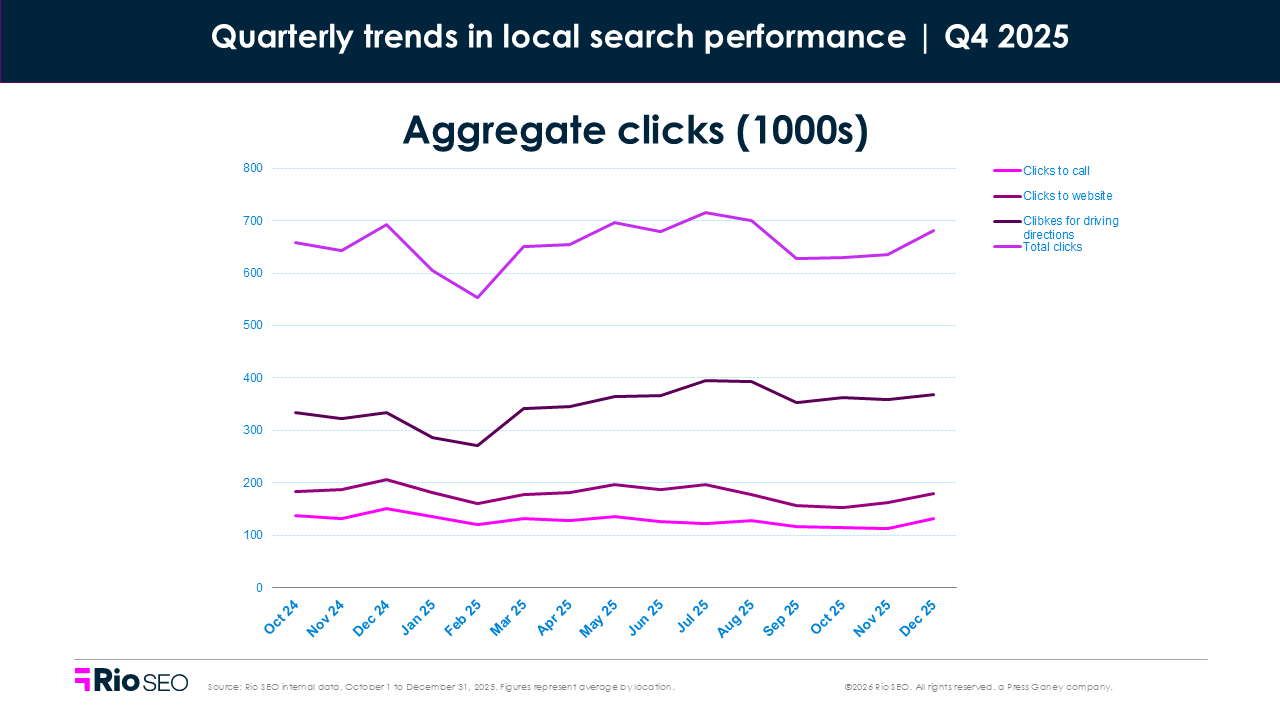
Clicks dropped 4.8% quarter-over-quarter, suggesting that while more users saw listings, many found what they needed without taking additional action.
- Phone calls: –2.6%
- Website clicks: –6.8%
- Driving directions: –1.4%
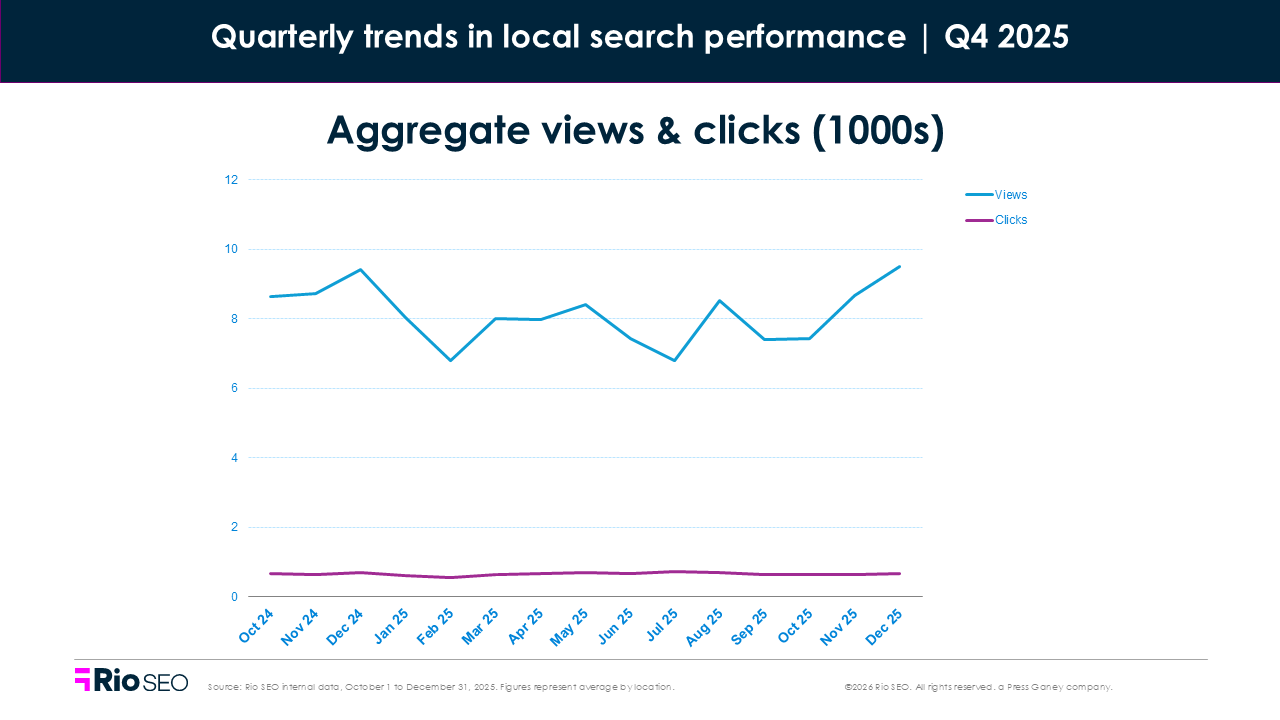
This aligns with the broader shift toward zero-click experiences, where AI-generated overviews, rich snippets, and enhanced local listings surface answers directly in the search interface. As listings become more complete and search becomes more predictive, users may not need to click through to convert.
Visibility is still critical. But clarity, completeness, and confidence-building content are what move users from intent to action, even if that action happens off page.
Retail
- Total Q4 2025 views: +36% QoQ, +7.8% YoY
- Total Q4 2025 clicks: +0.8% QoQ, -1.4% YoY
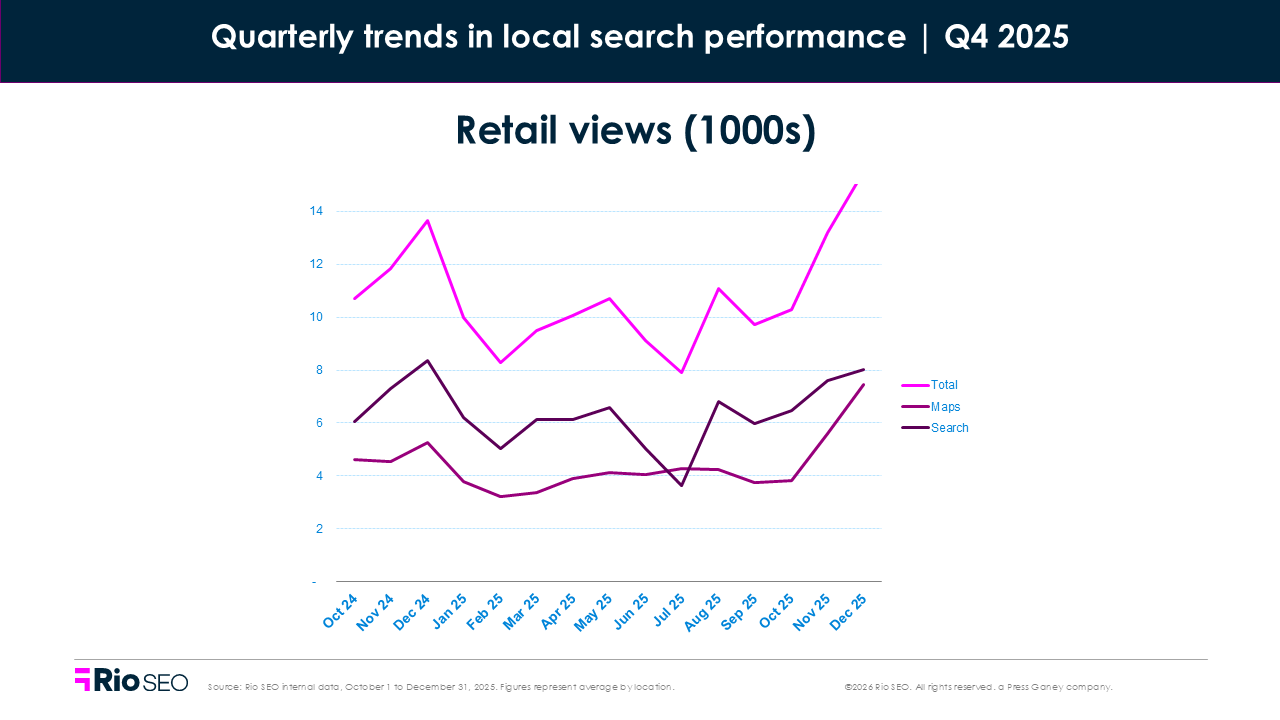
Map (+37.7%) and Search (+34.7%) views surged, pointing to renewed discovery activity heading into the holidays. That aligns with early reports from Visa and Mastercard showing ~4% U.S. holiday retail sales growth—a sign that consumers were shopping actively, both online and in-store.
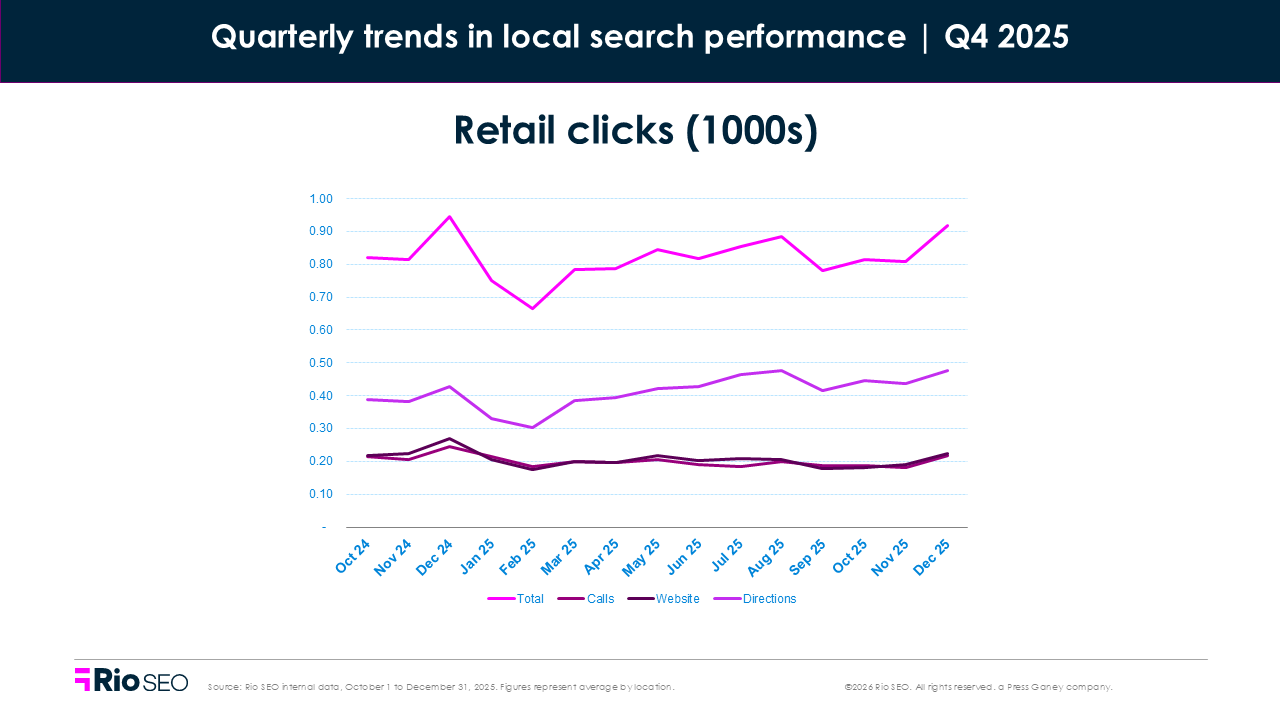
Clicks told a more tempered story. Total clicks rose just 0.8% quarter-over-quarter and remained slightly behind last year (–1.4% YoY), indicating that even as listings gained exposure, engagement didn’t climb at the same pace. Most of the growth came from phone calls (+2.8%), likely tied to high-intent scenarios such as store hours, inventory checks, or pickup logistics. Website clicks were essentially flat (+0.6%), and driving direction requests grew by only 0.1%.
This suggests a few trends: shoppers are browsing more locally, turning to listings for quick answers, and making decisions faster — often without clicking through. With AI-powered summaries and action-rich listings doing more of the heavy lifting, the path to purchase is shortening.
Where to focus next
- Keep listings accurate across all locations, especially for hours, inventory, and holiday updates — the basics still drive foot traffic.
- Use real-time inventory feeds to surface available products in local search results and reduce friction.
- Optimize GBP for high-intent actions like “Get directions” and “Call now” — they’re still your best signals of conversion readiness.
- Prioritize mobile experience, since most local retail searches start and end on phones.
- Leverage AI-driven personalization to tailor promotions, product suggestions, and follow-ups — especially during peak seasonal moments. Want to see what a fully personalized local journey looks like? Explore this guide.
Financial services
- Total Q4 2025 views: +1.7% QoQ, -12.9% YoY
- Total Q4 2025 clicks: -3.2% QoQ, +1.8% YoY
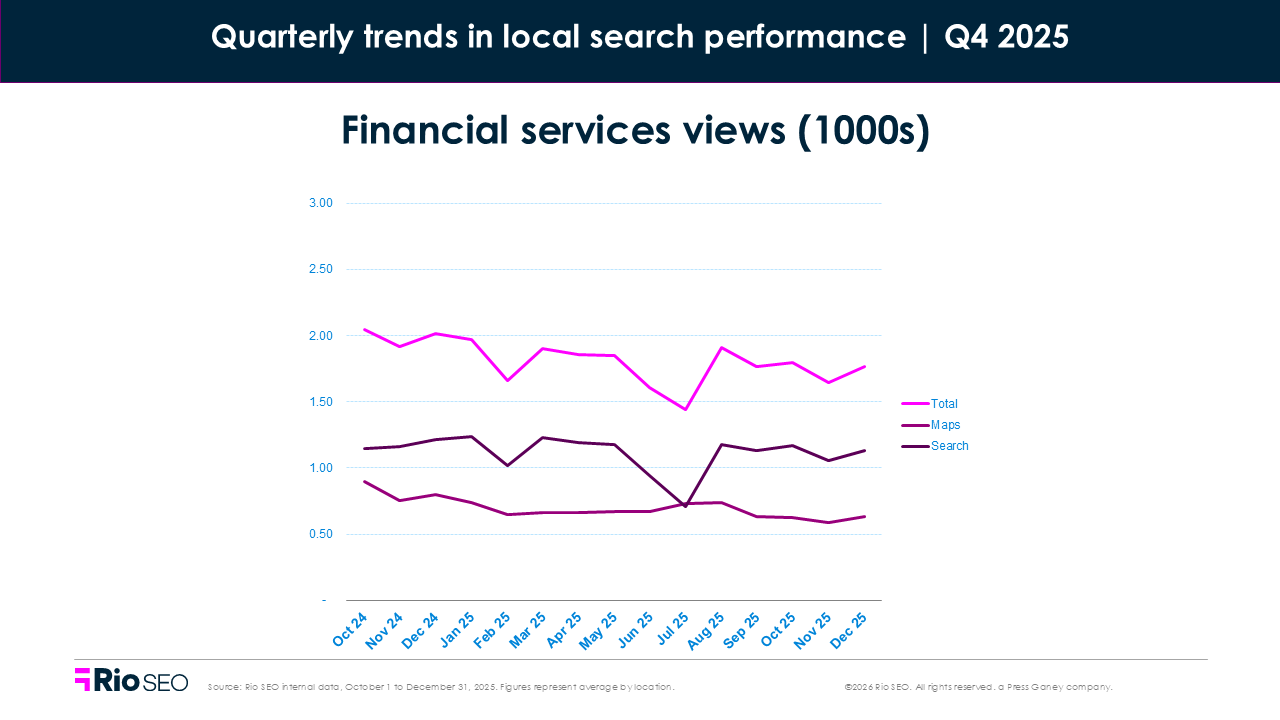
After a visibility slump earlier in the year, financial services listings stabilized in Q4. Views rose slightly quarter-over-quarter, driven entirely by Search views (+11.2%), while Map views declined (–12.0%). It’s a signal that more users are evaluating providers via search results rather than map-based discovery and it’s the first we’ve seen Search and Maps views trend this way in a while.
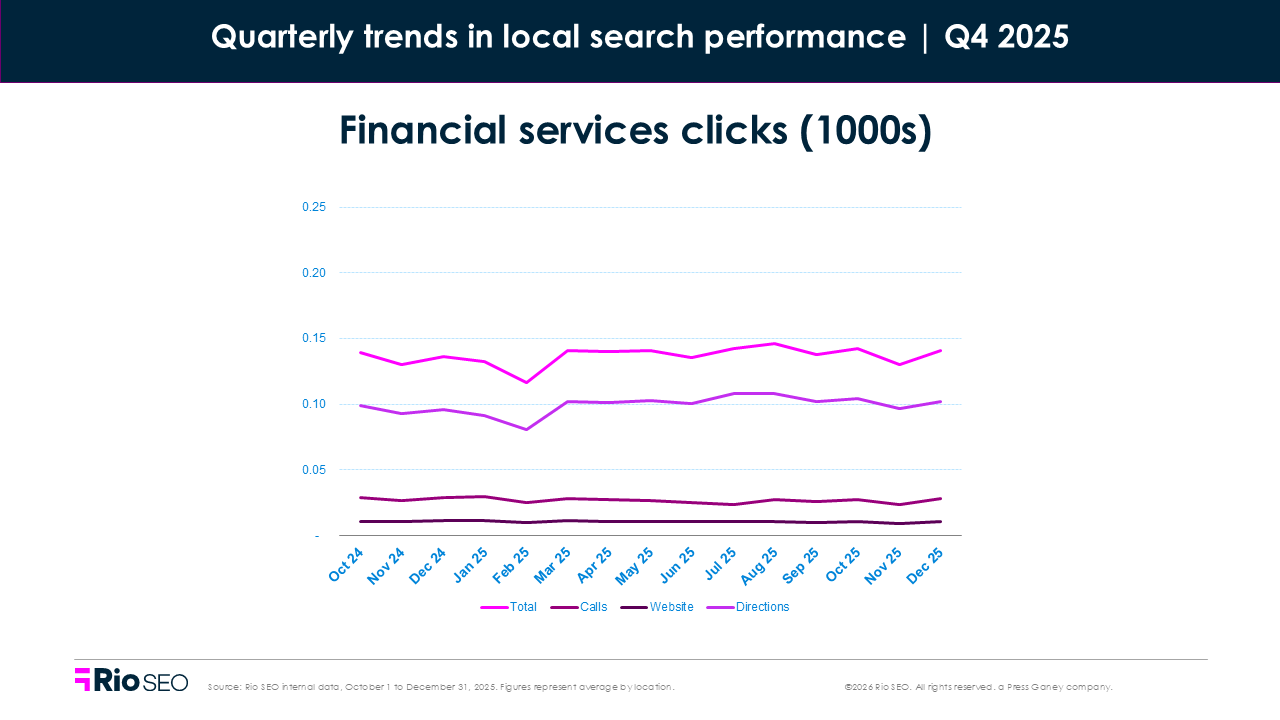
Clicks dipped overall quarterly and were down dramatically from 2024. Phone inquiries rose (+2.8%) from Q3, but website (-4.3%) and driving direction clicks (-4.5%) fell — suggesting that while some consumers reached out directly, fewer advanced to in-person visits or deeper digital engagement.
The macro context offers some explanation: U.S. banks reported strong Q4 profits, fueled by resilient consumer borrowing. But that strength doesn’t automatically translate to local action. Financial brands still need to meet rising expectations around transparency, digital experience, and trust.
Compared to last year, total views per location fell -20.6%, compounding the decline from the -17.3% drop YoY from 2023 to 2024. Financial services consumers are clicking less, too, as we see that metric -6.4% from 2024.
Where to focus next
- Audit listings regularly for hours, services, and appointment options; 53% of consumers say they’re unlikely to visit a business with inaccurate listings, and even small discrepancies can cost visits.
- Highlight local advisors, specialties, and GBP services to give consumers clear reasons to choose your brand over national alternatives.
- Track branch-level direction requests to identify growth hotspots and optimize in-person service.
- Ensure CTAs like “Schedule an appointment” are visible on mobile — that’s where most customers are making decisions.
Service businesses
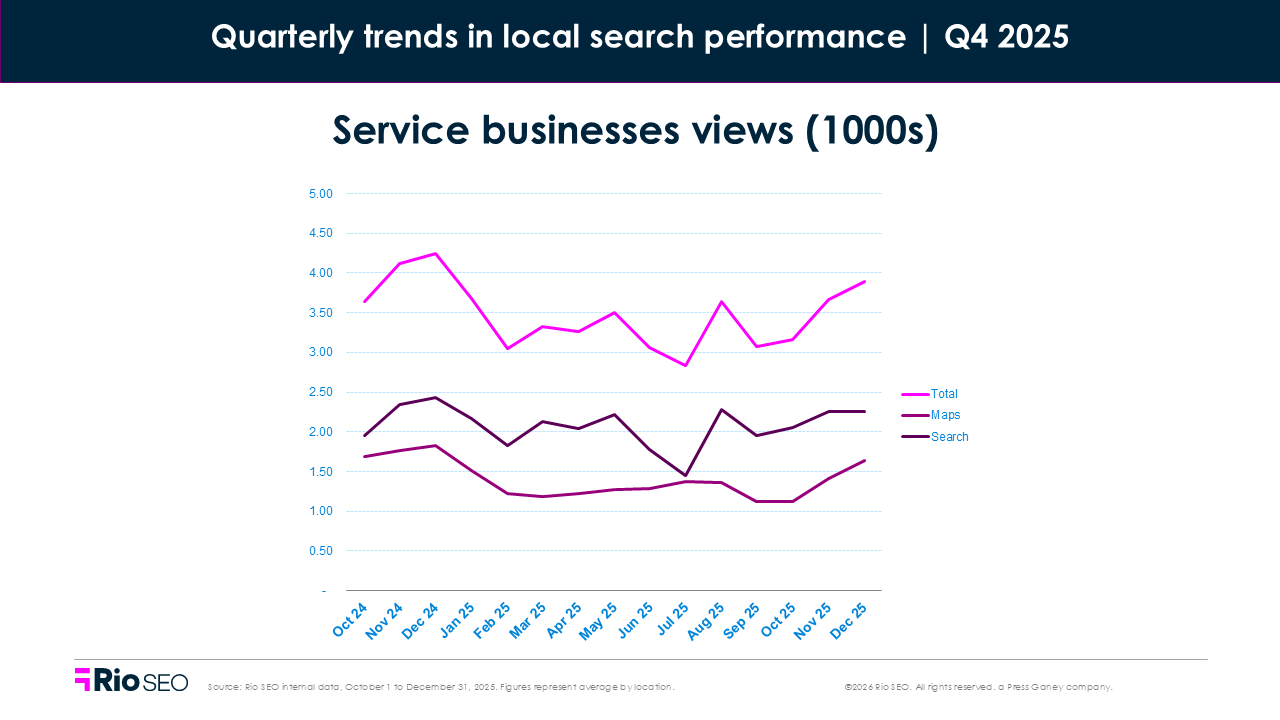
- Total Q4 2025 views: +12.3% QoQ, -10.8%
- Total Q4 2025 clicks: -3.3% QoQ, -5.3% YoY
Service businesses — from gyms and salons to post offices, pet care, and auto shops — saw a healthy rebound in visibility this quarter. Search views were up 15.4%, and map views climbed 7.7%, signaling that consumers are still actively looking for local services.
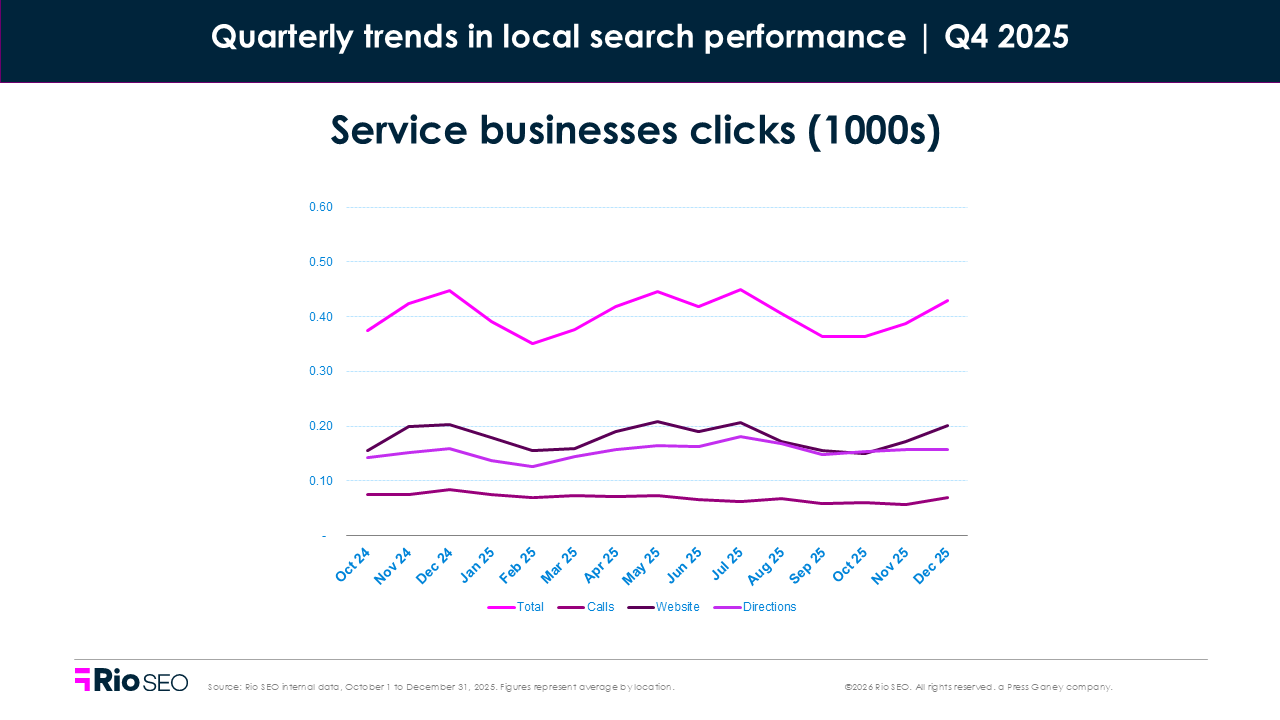
But engagement tells a more complex story. Clicks fell across all categories, including phone calls (–1.1%), website visits (–1.9%), and driving directions (–5.5%). That decline doesn’t mean interest is down—it suggests that more users are finding what they need directly in search, without clicking through.
Service business views per location fell -17.4% YoY, surpassed only by Restaurants (-31.7%) and Financial Services (-21.1%) in terms of reduced views. However, as we’ve pointed out, that doesn’t mean brands aren’t being found in AI answers.
In a world of AI-powered search and zero-click answers, listings need to work harder. Consumers are making decisions inside the results page, not after clicking through to check things out. That makes full, structured, and accurate listings non-negotiable. If your services aren’t clearly listed, your photos are outdated, or your information is inconsistent across platforms, you risk being skipped by both people and algorithms serving them instant answers.
Where to focus next
- Monitor and update your listings regularly to ensure service details, hours, and location data stay accurate across platforms like Google and Apple Maps.
- Add structured data to highlight services and availability (like classes, bookings, or appointments), so answer engines can surface your offerings correctly.
- Refresh photos and business descriptions to stand out in visual results and map packs, where trust is earned at a glance.
- Invest in brand experience, including consistency across reviews, listings, and on-site service, to build trust at scale.
Healthcare
- Total Q4 2025 views: -8.8% QoQ, +3.2% YoY
- Total Q4 2025 clicks: -5.2% QoQ, +8.3% YoY
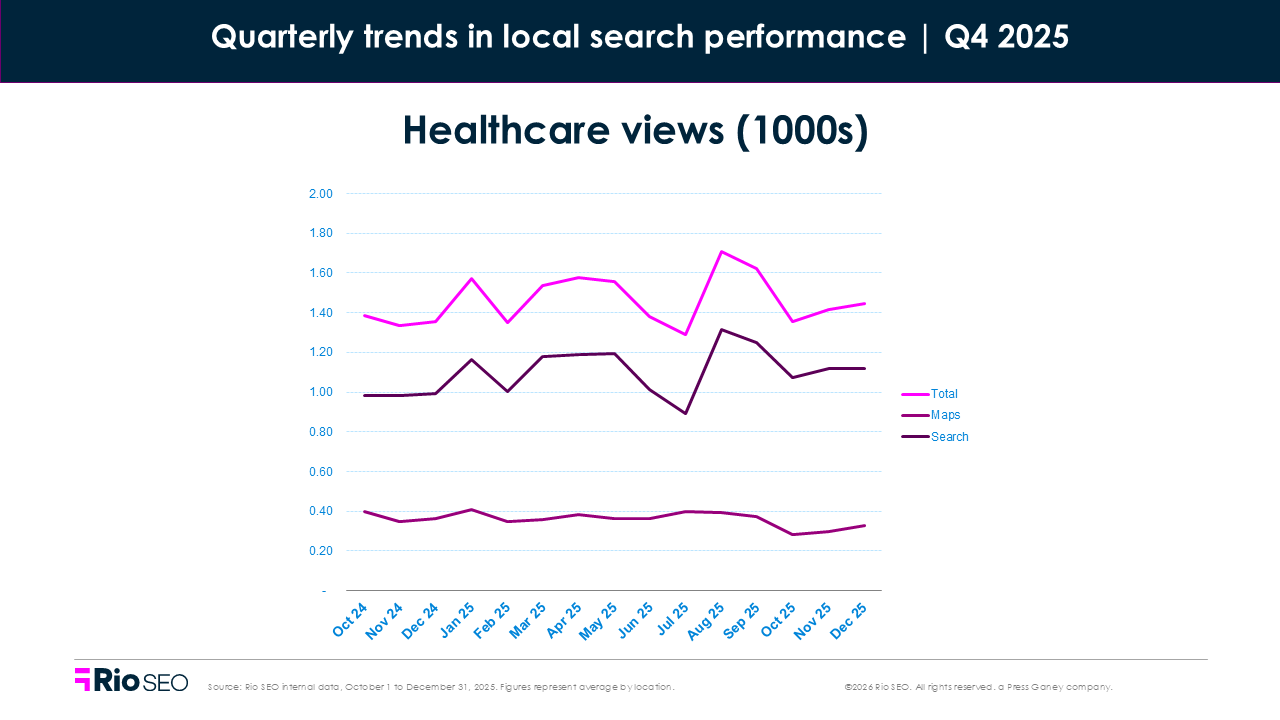
Q4 introduced some turbulence in healthcare visibility. Views dropped 8.8% from Q3, driven largely by a steep -22.5% decline in Map views, while Search views fell a more moderate -4.2%. But the bigger story is in the engagement: despite the visibility dip, clicks still rose +8.3% YoY. It’s proof that high-intent patients are still finding and acting on relevant listings.
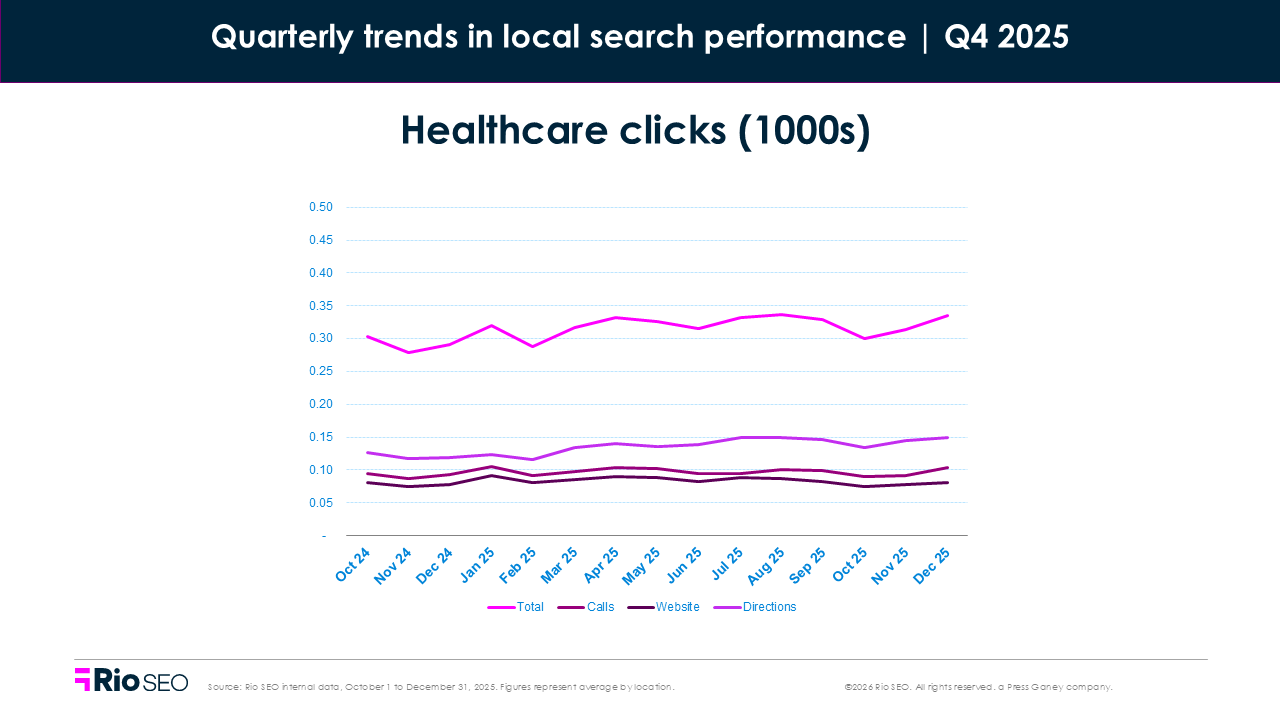
Driving direction clicks fell 4.2%, and website clicks dropped 9.1%, pointing to increased selectivity. Patients aren’t browsing. They’re scanning, judging, and acting fast once trust is established. That tracks with industry data showing a long-term rise in patient visits per provider — even through seasonal lulls and softening primary care interest online.
With fewer paths to discovery and a growing focus on patient experience, healthcare brands must prioritize clarity, accessibility, and relevance across every local entry point.
Where to focus next
- Use Specialty Pages to surface high-demand services like diagnostics, urgent care, and specialty clinics. Get the Local Pages Playbook
- Emphasize trust signals like verified hours, accepted insurance, and provider bios on listings and local pages.
- Ensure accuracy in Map listings, especially for multi-location systems, as patients rely on these details to navigate care.
- Streamline booking experiences by linking directly to online scheduling or virtual visit options.
Hospitality
- Total Q4 2025 views: -17.8% QoQ, -15.8% YoY
- Total Q4 2025 clicks: -1.6% QoQ, +11.9% YoY
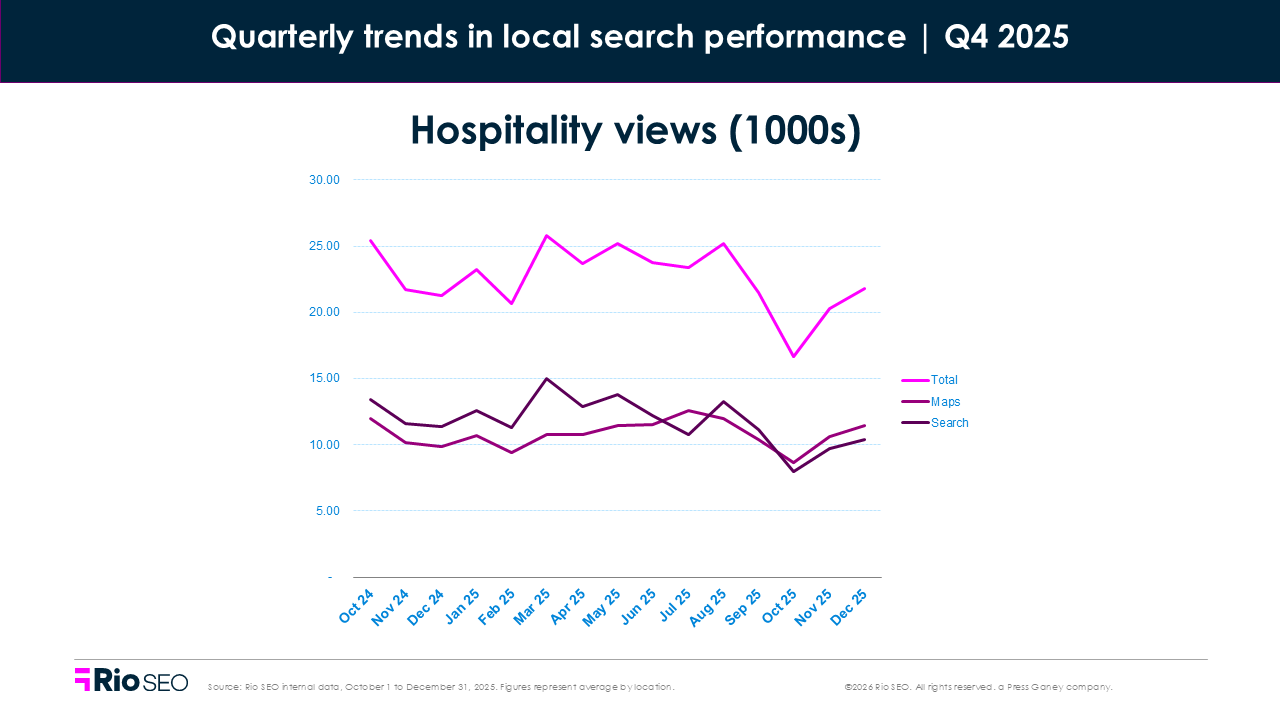
Hospitality visibility dropped sharply in Q4, with Search views down –21.7% and Map views falling –13.9%. That volatility reflects broader shifts in Google’s UI and user behavior, but the story doesn’t end there: despite fewer impressions, engagement remained strong. Total clicks rose +11.9% year-over-year, and driving directions increased +3.3% quarter-over-quarter—proof that travelers are still booking, just with more intent and less browsing.
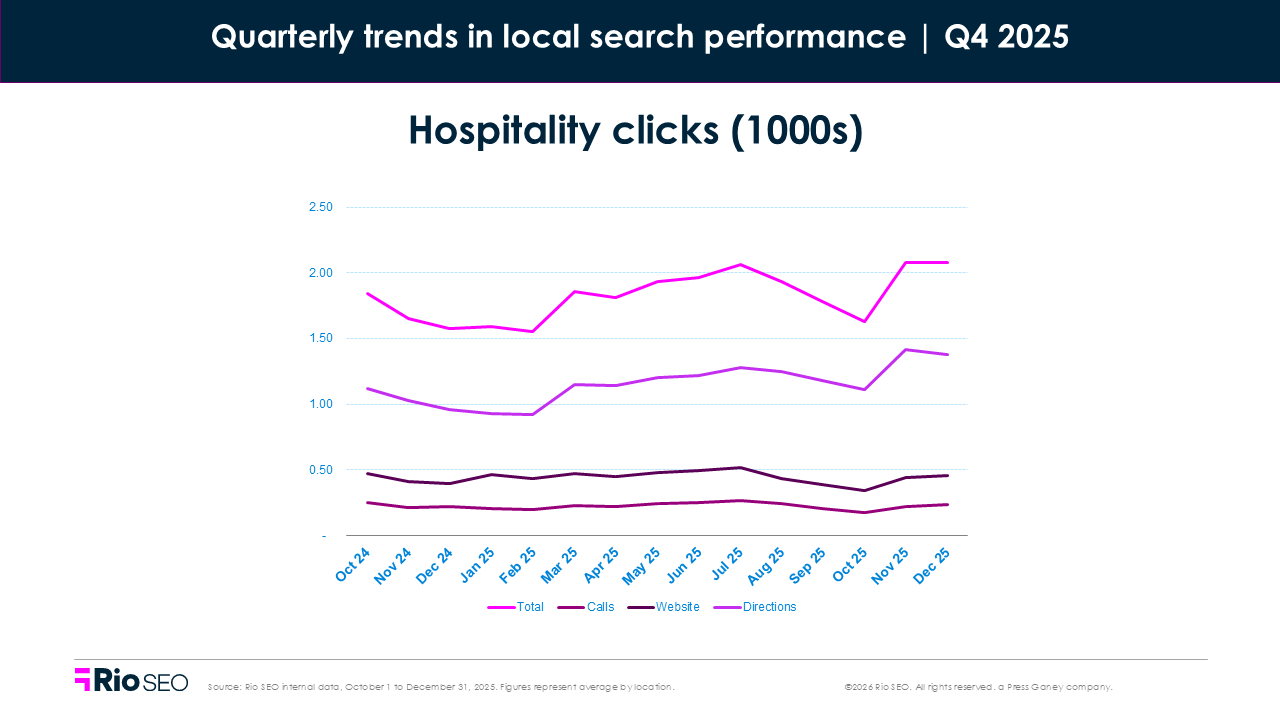
Industry trends back that up. While RevPAR softened slightly, overall occupancy held steady. Luxury and upper-upscale segments outperformed, posting RevPAR gains of +2.9% and +0.4% YTD, according to Cushman & Wakefield. Discerning guests are still spending, just more selectively.
For hospitality brands, the mission is clear: earn trust fast, convert in fewer steps, and make every listing ready to capture last-minute decisions.
Where to focus next
- Prioritize reputation management. 75% of consumers read at least four reviews before making a decision.
- Optimize local listings with clear, mobile-friendly CTAs like “Book Now” or “Check Availability.”
- Refresh photos and amenities to appeal to high-intent travelers comparing options quickly.
- Highlight premium experiences. With upper-tier properties outperforming, showcasing upgrades, packages, and differentiators pays off.
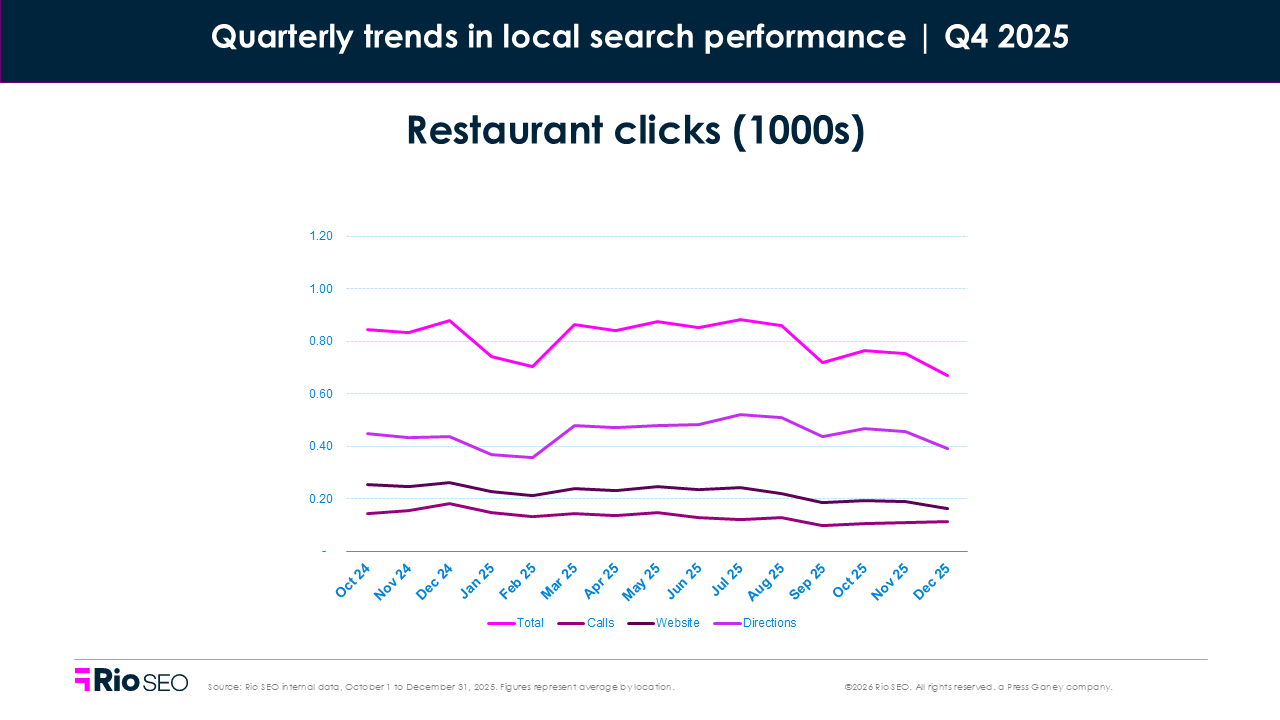
Restaurants
- Total Q4 2025 views: +17.8% QoQ, -13.2% YoY
- Total Q4 2025 clicks: -11.5% QoQ, -14.6% YoY
- Food orders per location: -74.5% QoQ, -82.5% YoY
- Food menu clicks per location: -15.0% QoQ, -21.5% YoY
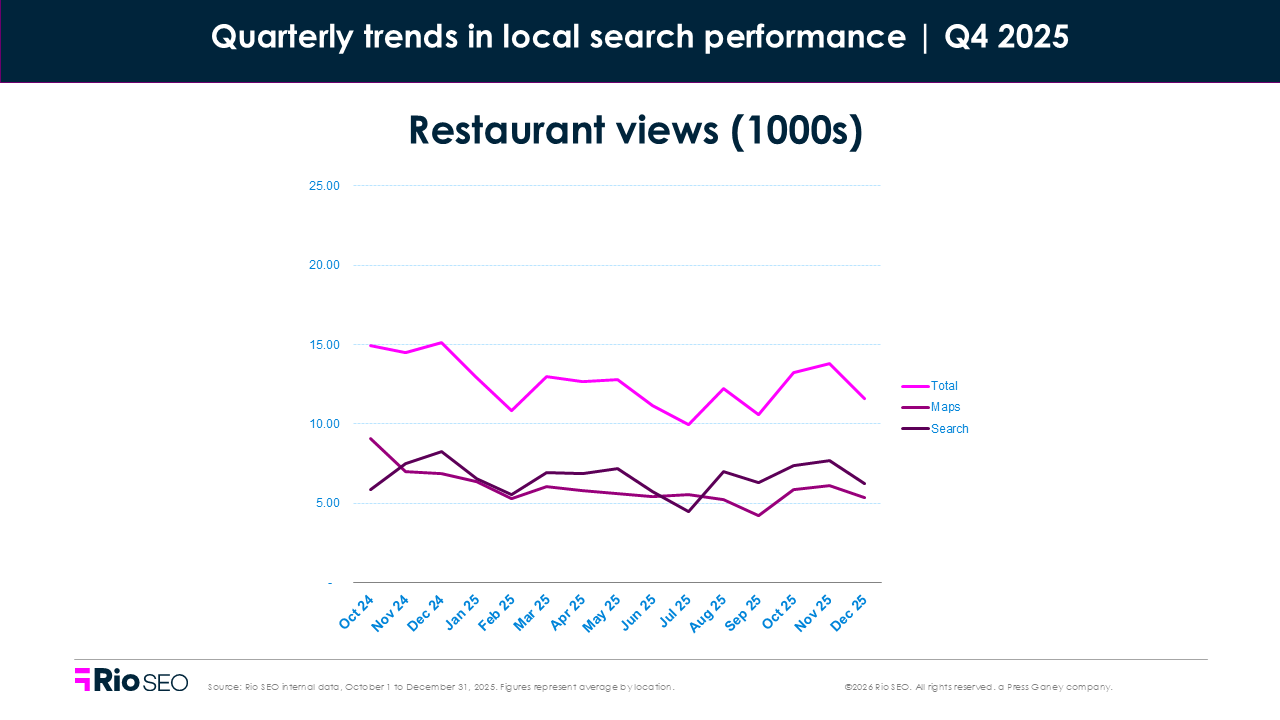
Restaurant visibility rebounded from Q3, with views rising nearly 18% QoQ. Both Search (+19.9%) and Maps (+15.5%) saw healthy growth, but that didn’t translate to clicks, which fell by 11.5%. The restaurant sector saw the largest drop in views per location (-31.7%), marking the second year of decline after a -18.1% drop from 2023 to 2024. The YoY losses this past quarter spanned both Maps (-40.1%) and Search (-22.5%) views.
The broader industry context mirrors this tension. According to Revenue Management Solutions, restaurant traffic slowed in Q4 as consumers grew more cautious with discretionary spending. Quick service and fast casual brands leaned heavily on value-driven promotions, while giants like McDonald’s focused on restoring perceived value.
Casual dining was a relative bright spot, with chains like Darden exceeding revenue expectations (+7.3% YoY), especially in stronghold regions like Florida and the Southwest.
What it all means: diners are still searching, but price sensitivity is high and expectations are sharper. AI plays a role now, as in other sectors where diners are searching for information such as hours or menus and getting an AI response that answers the question, there’s no need for further action. Restaurants are competing not just on visibility, but on clarity, trust, and value — especially in that crucial moment between search and sale — and success may not show up as a click.
Where to focus next
- Surface your strongest value cues — portions, pricing, quality, and limited-time offers — early in local listings, and often in Google Posts, social media, and on landing and specialty pages.
- Keep menus fresh and accurate to encourage conversions when visibility spikes.
- Monitor food order CTAs and platforms, testing new messaging and offers to revive performance.
- Respond to reviews quickly to build trust and edge out nearby competitors.
- Expand your understanding of the path to local visibility and discovery in AI-driven search.
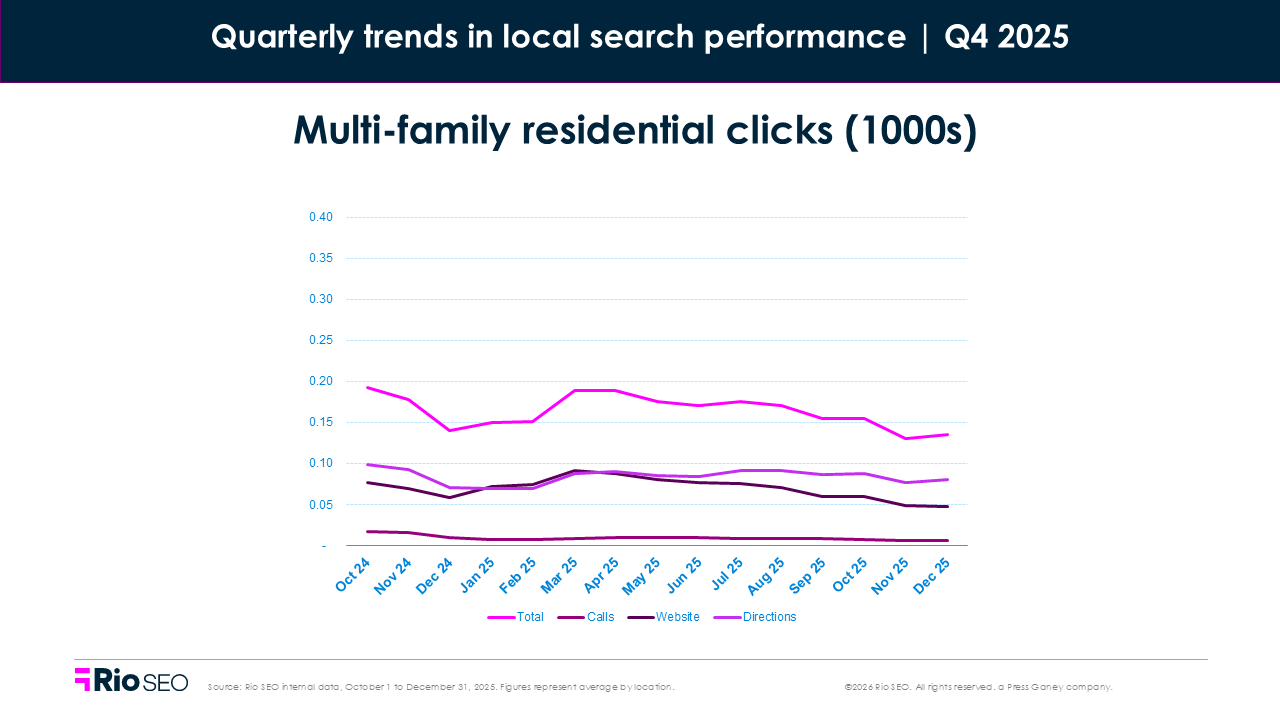
Multi-family residential
- Total Q4 2025 views: -15.3% QoQ, +8.5% YoY
- Total Q4 2025 clicks: -16.2% QoQ, -17.6% YoY
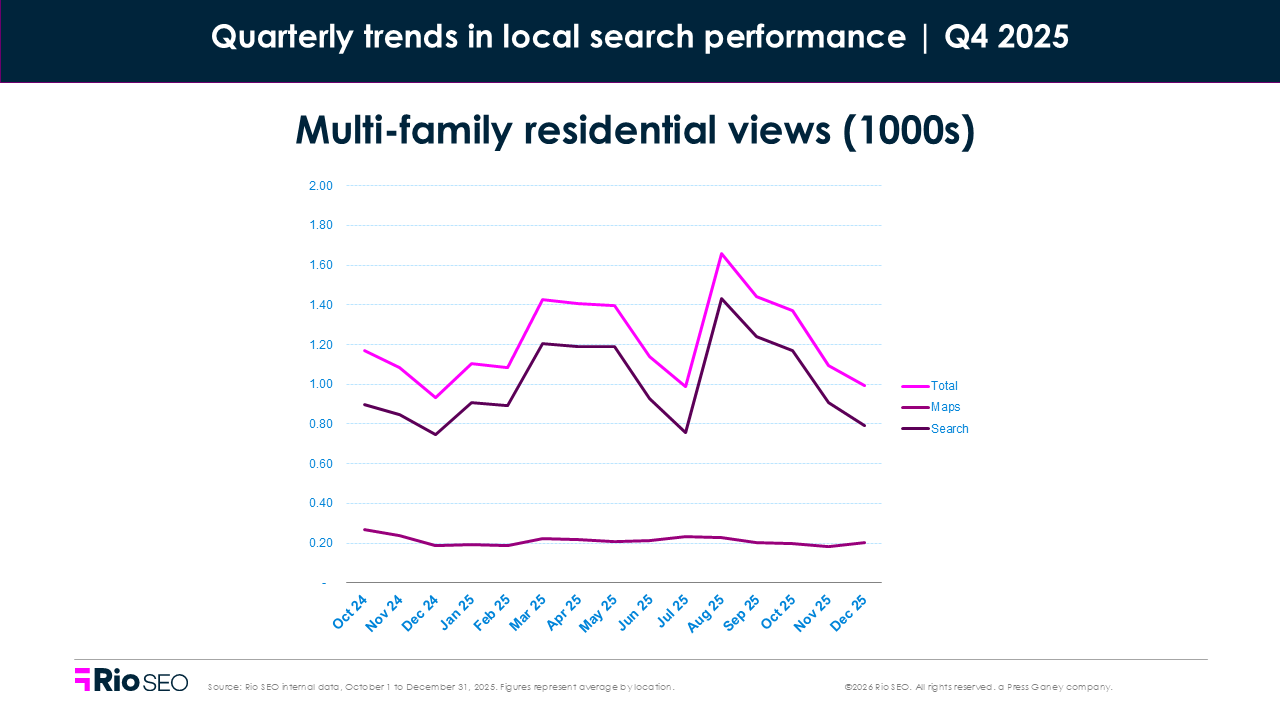
After a strong Q3, visibility for multi-family listings softened in Q4, down more than 15% quarter-over-quarter. Clicks declined even further (–16.2% QoQ), with sharper drops in website clicks (–24.4%) and phone calls (–20.4%). Search views fell –16.1%, and even driving direction clicks—often a sign of strong intent—slipped nearly 10%.
The broader market followed a similar arc. Multifamily demand eased in Q4, as expected, but 2025 still closed strong with 355,000 units absorbed nationally — the third-highest total in 25 years.
Vacancy rates held stable near 6.5%, though advertised rents flattened, dipping 0.9% in Q4. Notably, construction starts hit decade lows, signaling less new inventory coming online in 2026 and potentially tighter competition for qualified renters.
For multi-family marketers, the message is clear: visibility alone won’t drive leases. Search behavior is active, but renters are comparing more, acting slower, and seeking clear value — especially when price and supply remain steady.
Where to focus next
- Refresh listings frequently with updated pricing, availability, amenities, and photos to stay competitive.
- Highlight value differentiators like move-in incentives, pet policies, or flexible lease terms early in the listing.
- Track direction and website clicks by property to spot high-interest communities and optimize digital ad spend.
- Support each property with a well-optimized local page, especially in regions with slower lease-up activity.
- Look beyond Google; make sure you’re optimizing for the Apple ecosystem.
Rethinking local visibility in 2025 and beyond
Q4 2025 reinforced a fundamental shift in local discovery. Visibility is no longer a guarantee of engagement, and clicks are no longer the sole measure of success. As Google’s UI shifts and AI-driven results reshape the search journey, brands that rely on outdated metrics or incomplete listings are getting left behind.
But the opportunity is still huge. Consumers are searching daily. They’re still showing up, still clicking — just more selectively, and with higher expectations.
The brands winning today are doing more with less: optimizing every listing, testing every CTA, and delivering consistent, credible experiences across every touchpoint.
AI and answer engines are raising the bar. For marketers willing to adapt, they’re also expanding the path to conversion. Now’s the time to rethink your local presence from the ground up.
Want to know where you stand? A local audit can uncover hidden gaps, growth opportunities, and the opportunities that matter most in an AI-driven search landscape.
Related resources

How Health First strengthened digital trust, improved provider visibility, and deepened patient engagement

2026 Google local search report

Answer engines and automation: What’s next for enterprise reputation
Newsletter
Get industry insights that matter, delivered direct to your inbox
We collect this information to send you free content, offers, and product updates. Visit our recently updated privacy policy for details on how we protect and manage your submitted data.