Local consumer search behavior trends in Q3 2023

Want to learn more? See our latest in-depth analysis of Google Business Profile trends by vertical, and catch our 2023 Local search ranking factors breakdown webinar on demand now for more insights to fuel your enterprise local marketing strategy.
What do your brand’s Google Business Profile (GBP) performance metrics tell you about the experiences customers are having in each of your locations? Each quarter, we publish trends and insights from our analysis of over 230,000+ enterprise business locations across eight types of business.
These high-level insights and customer experience (CX) trends from our GBP performance research will help give your brand’s metrics context. We’ll share helpful tips to improve your local marketing strategy along the way, too.
In this past quarter, we saw business services, restaurants, and hotel brands getting all kinds of attention with quarterly gains in total search impressions. Retailers are battling a difficult economy and inflationary woes, while healthcare brands can finally feel the foot coming off the gas as COVID continues to subside. Dig into more industry-specific insights below.
Business services
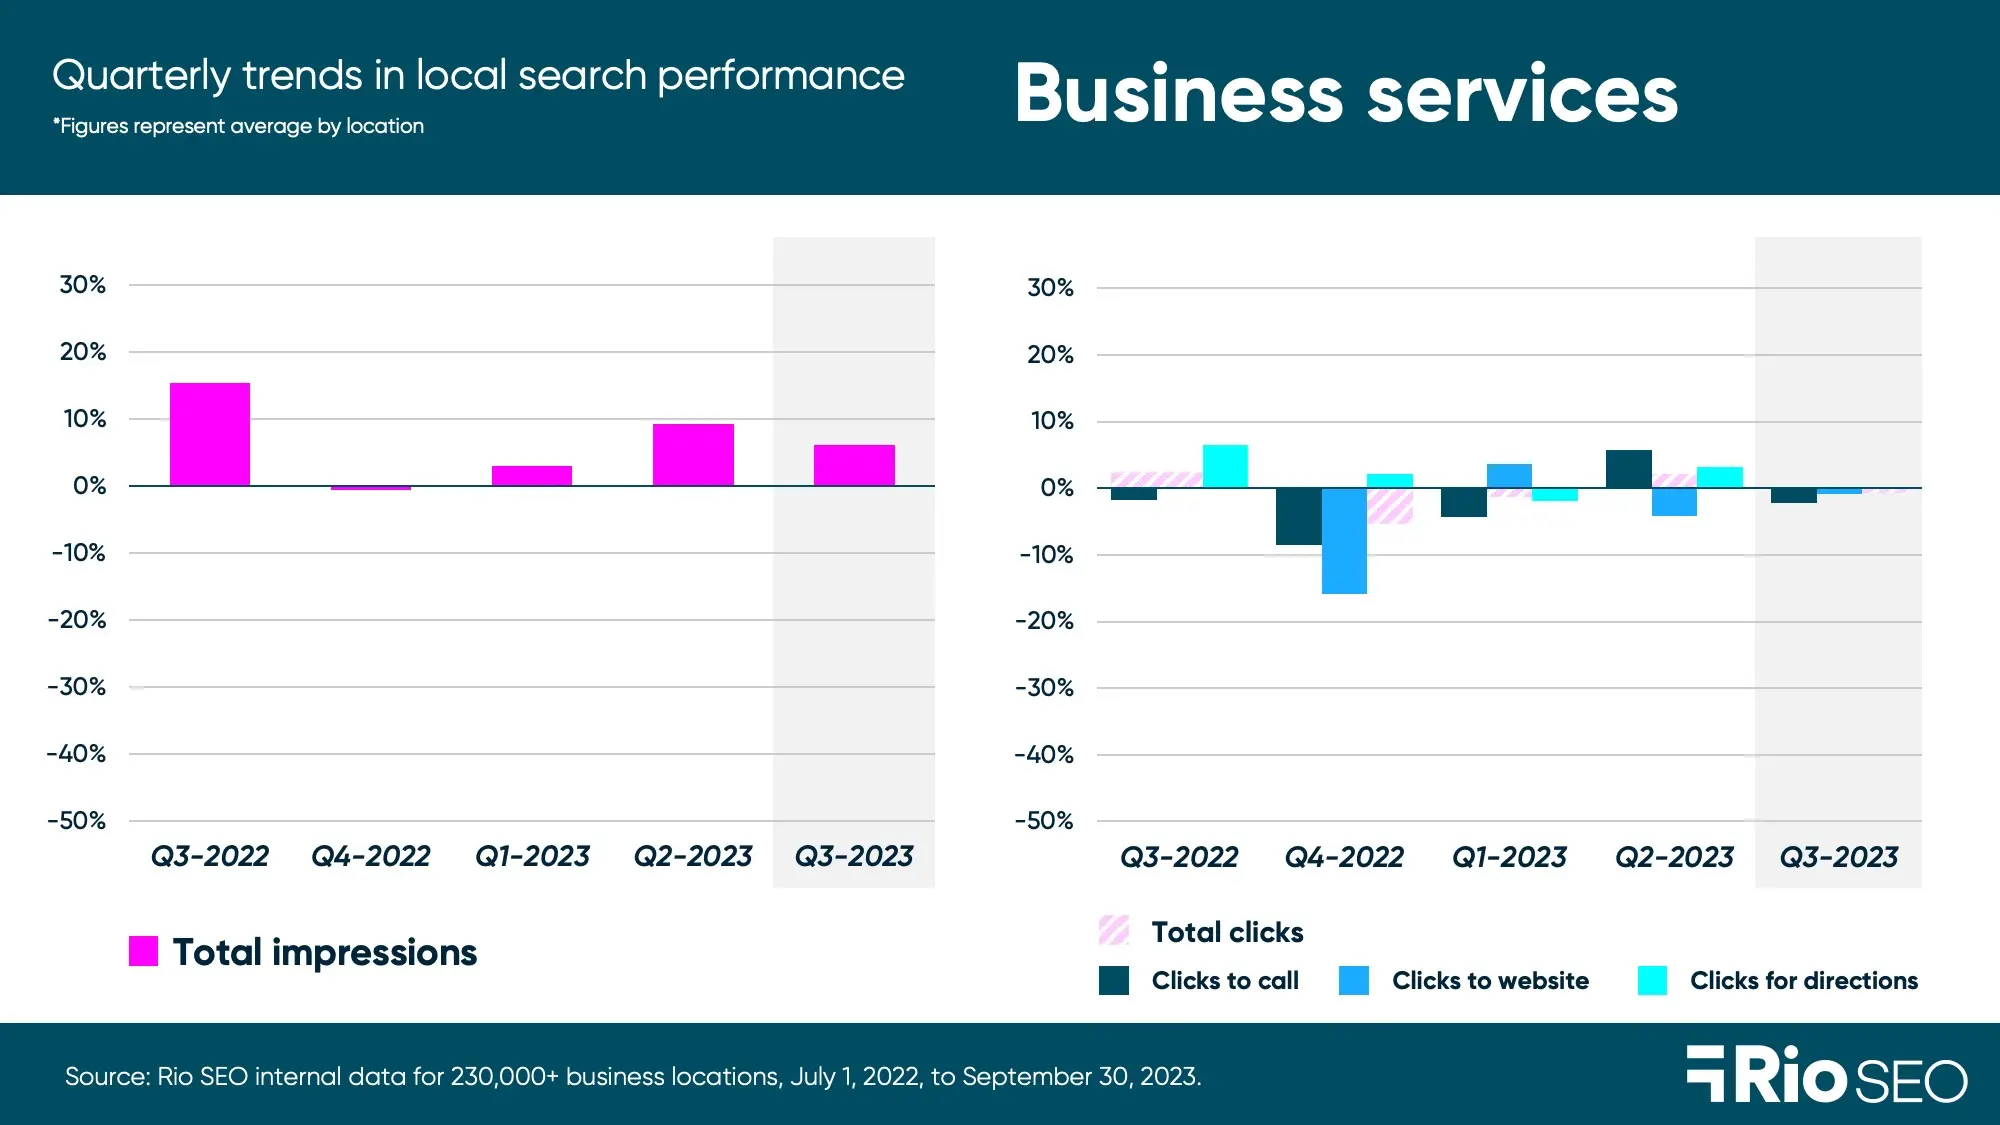
- Total Q3 2023 impressions +6.1% QoQ and +18.8% YoY.
- Total Q3 2023 clicks -0.8% QoQ and -5.3% YoY.
Total impressions for business services brands such as gyms, salons, post offices, and IT facilities grew again on both a quarterly (+6.1%) and annual (+18.8%) basis in Q3. That’s in addition to gains of +9.3% QoQ and +26.7% YoY in Q2 2023.
Total clicks were down slightly by -0.8% for the period from July to September, after having risen +7.03% last quarter. Year-over-year, Q3 clicks to call a location, get directions, or visit its website fell -5.3%.
Capitalize on those impressions by giving customers options and actions to take. Use Google Posts to showcase locally relevant offers, events, and updates about products, services, team members and more. Google Posts allow your locations to share high-quality photos or video with compelling text and a link to direct customers to take next steps. Download Google Posts 101: Creating Engaging, Eye-Catching Posts to learn more.
Financial services
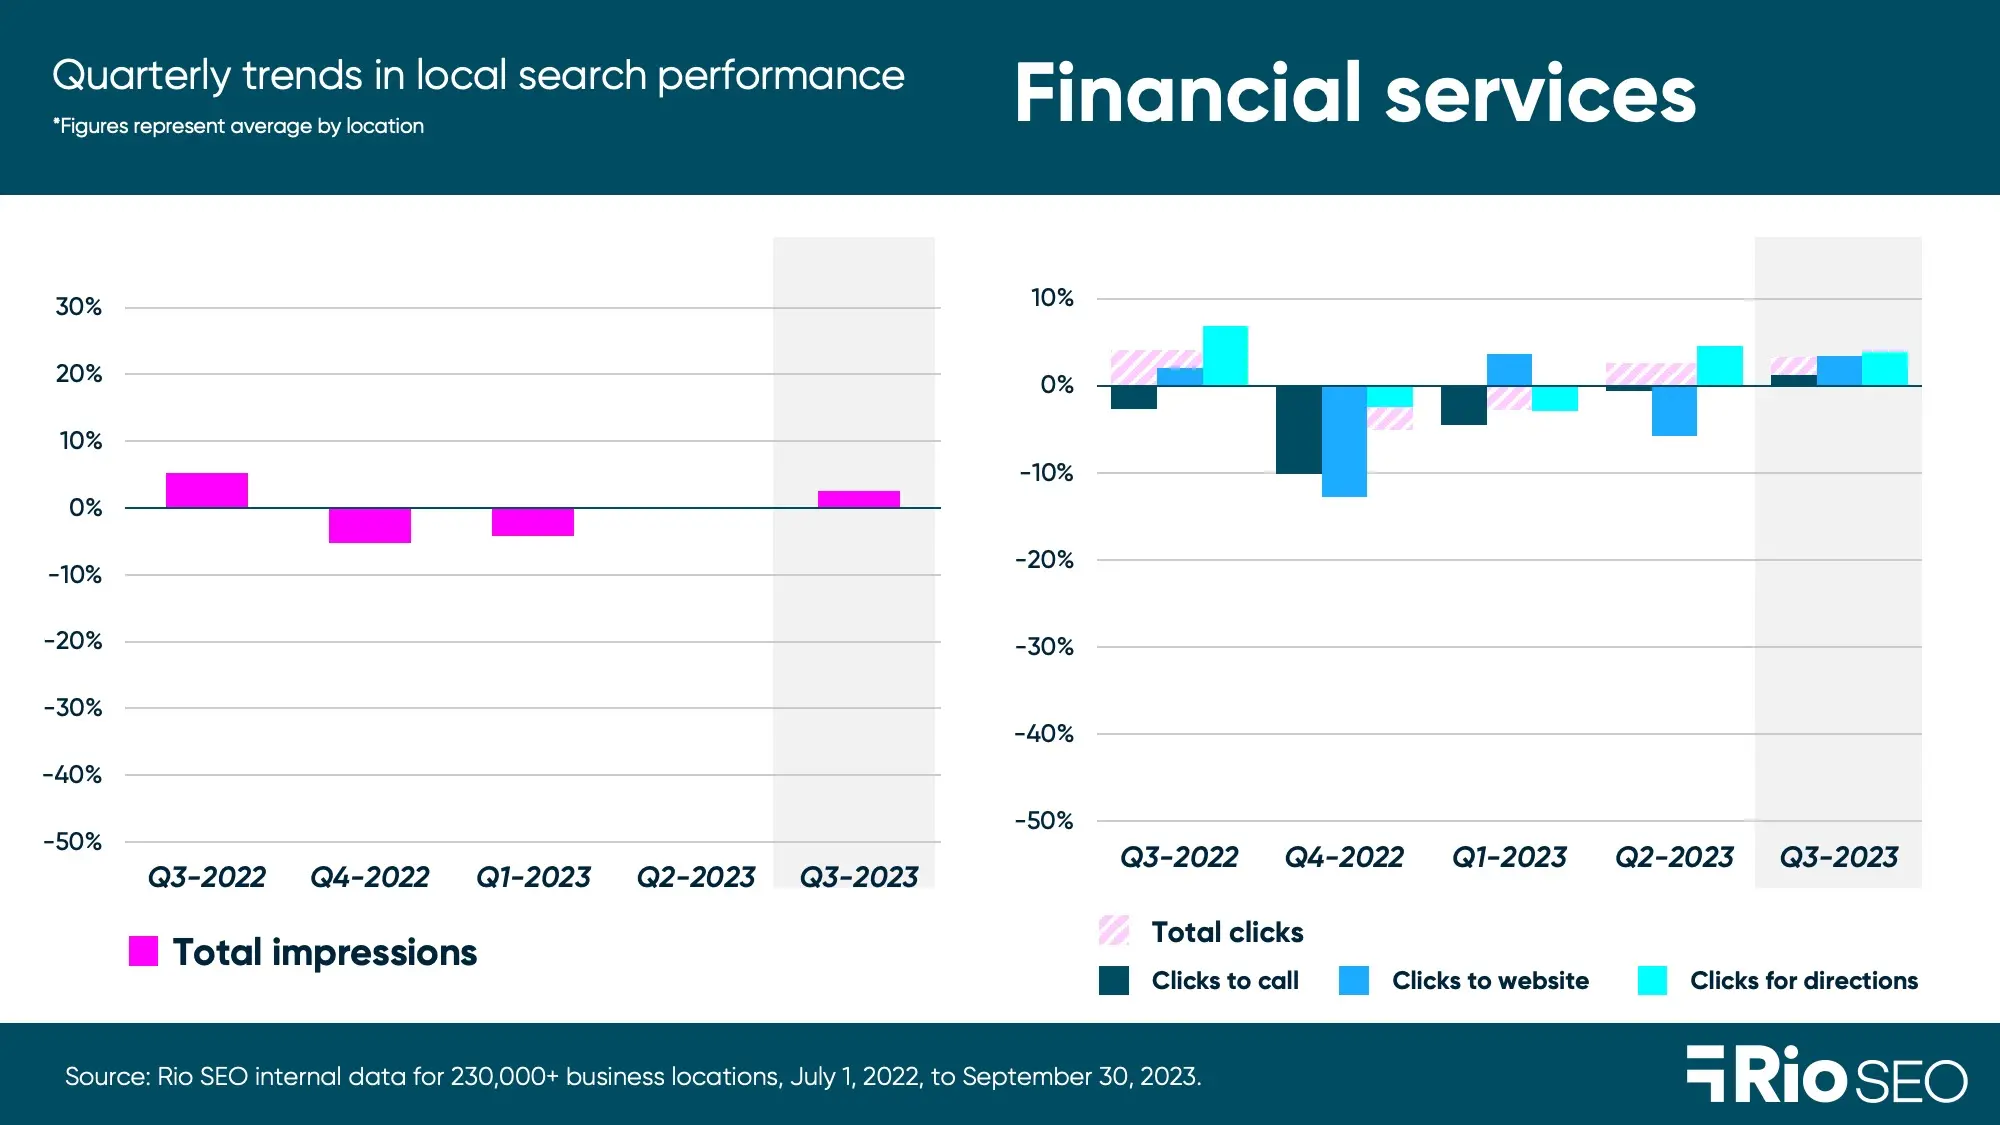
- Total Q3 2023 impressions: +2.5% QoQ and -7.1% YoY
- Total Q3 2023 clicks: +3.3% QoQ and -2.1% YoY
Financial services brands spanning banks, investment companies, insurance agencies and insurance companies and other financial institutions saw GBP impressions climb slightly by +2.5% QoQ. Conversion actions grew again in Q3 by +3.3% on the heels of a 4.1% QoQ increase in Q2, but came in slightly lower (-2.1%) than in the same period last year.
Trust is essential in financial services, making proactive listings management mission critical. There are many ways for inaccurate and duplicate listings to appear – when customers can’t find a listing so create a new one to make a review, for example. Or when insurance agents create individual listings that are abandoned when they switch companies.
When customers are presented with inaccurate listings in search, they lose trust in the brand. Meet customers in their decision-making moments with top quality listings that increase conversions and drive revenue. Put technology to work monitoring listings in real-time and flagging anything that needs human intervention for review.
Full-service restaurants
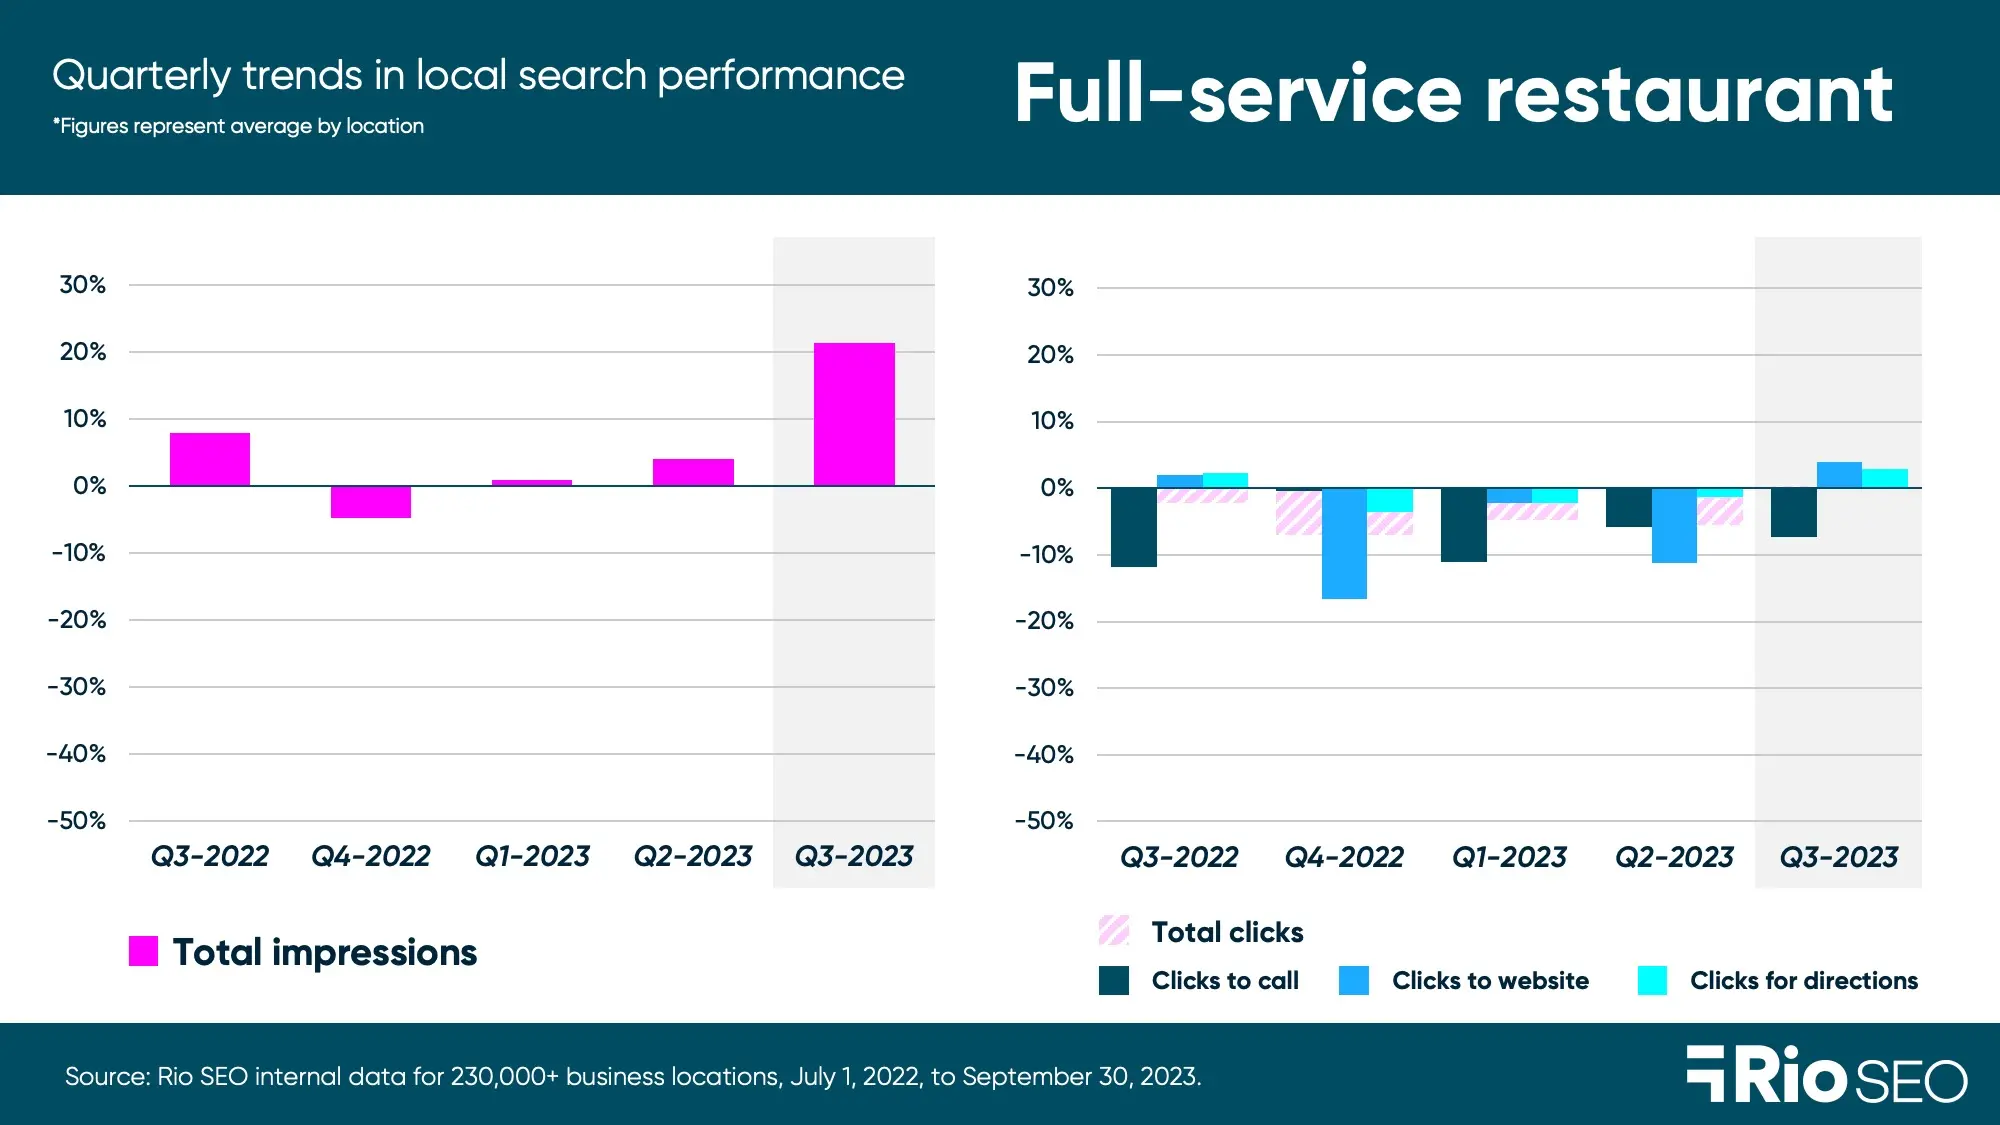
- Total Q3 2023 impressions: +21.3% QoQ and +21.4% YoY
- Total Q3 2023 clicks: +0.3% QoQ and -16.2% YoY
- Q3 2023 food menu clicks +112% QoQ and -6.4% YoY
- Q3 2023 bookings: -15% QoQ and -33.7% YoY
- Q3 2023 food order clicks: +0.2% QoQ and -31.2% YoY
Full-service restaurants have more GBP performance metrics to consider than most categories, since Google added Food Menu, Bookings, and Food order clicks to restaurant reporting. This quarter brought largely good news for the sector, with +21.3% more impressions and +112% Food Menu clicks than Q2.
Bookings were down by -15% this quarter and -33.7% lower than in Q3 2022. Food order clicks also fell by 31.2% YoY while Total Clicks (-16.2%) and Food Menu conversions (-6.4%) fell to a lesser degree compared to the same period last year.
In the highly competitive restaurant search listings, GBP Attributes can help yours stand out. Attributes are a great way to provide frequently requested information such as cuisine type, payment options, accessibility features, pickup and delivery options, and more. Choosing attributes for each location helps searchers looking for specific criteria to find just the right restaurant. Learn more about restaurant attributes here.
Quick-service restaurants
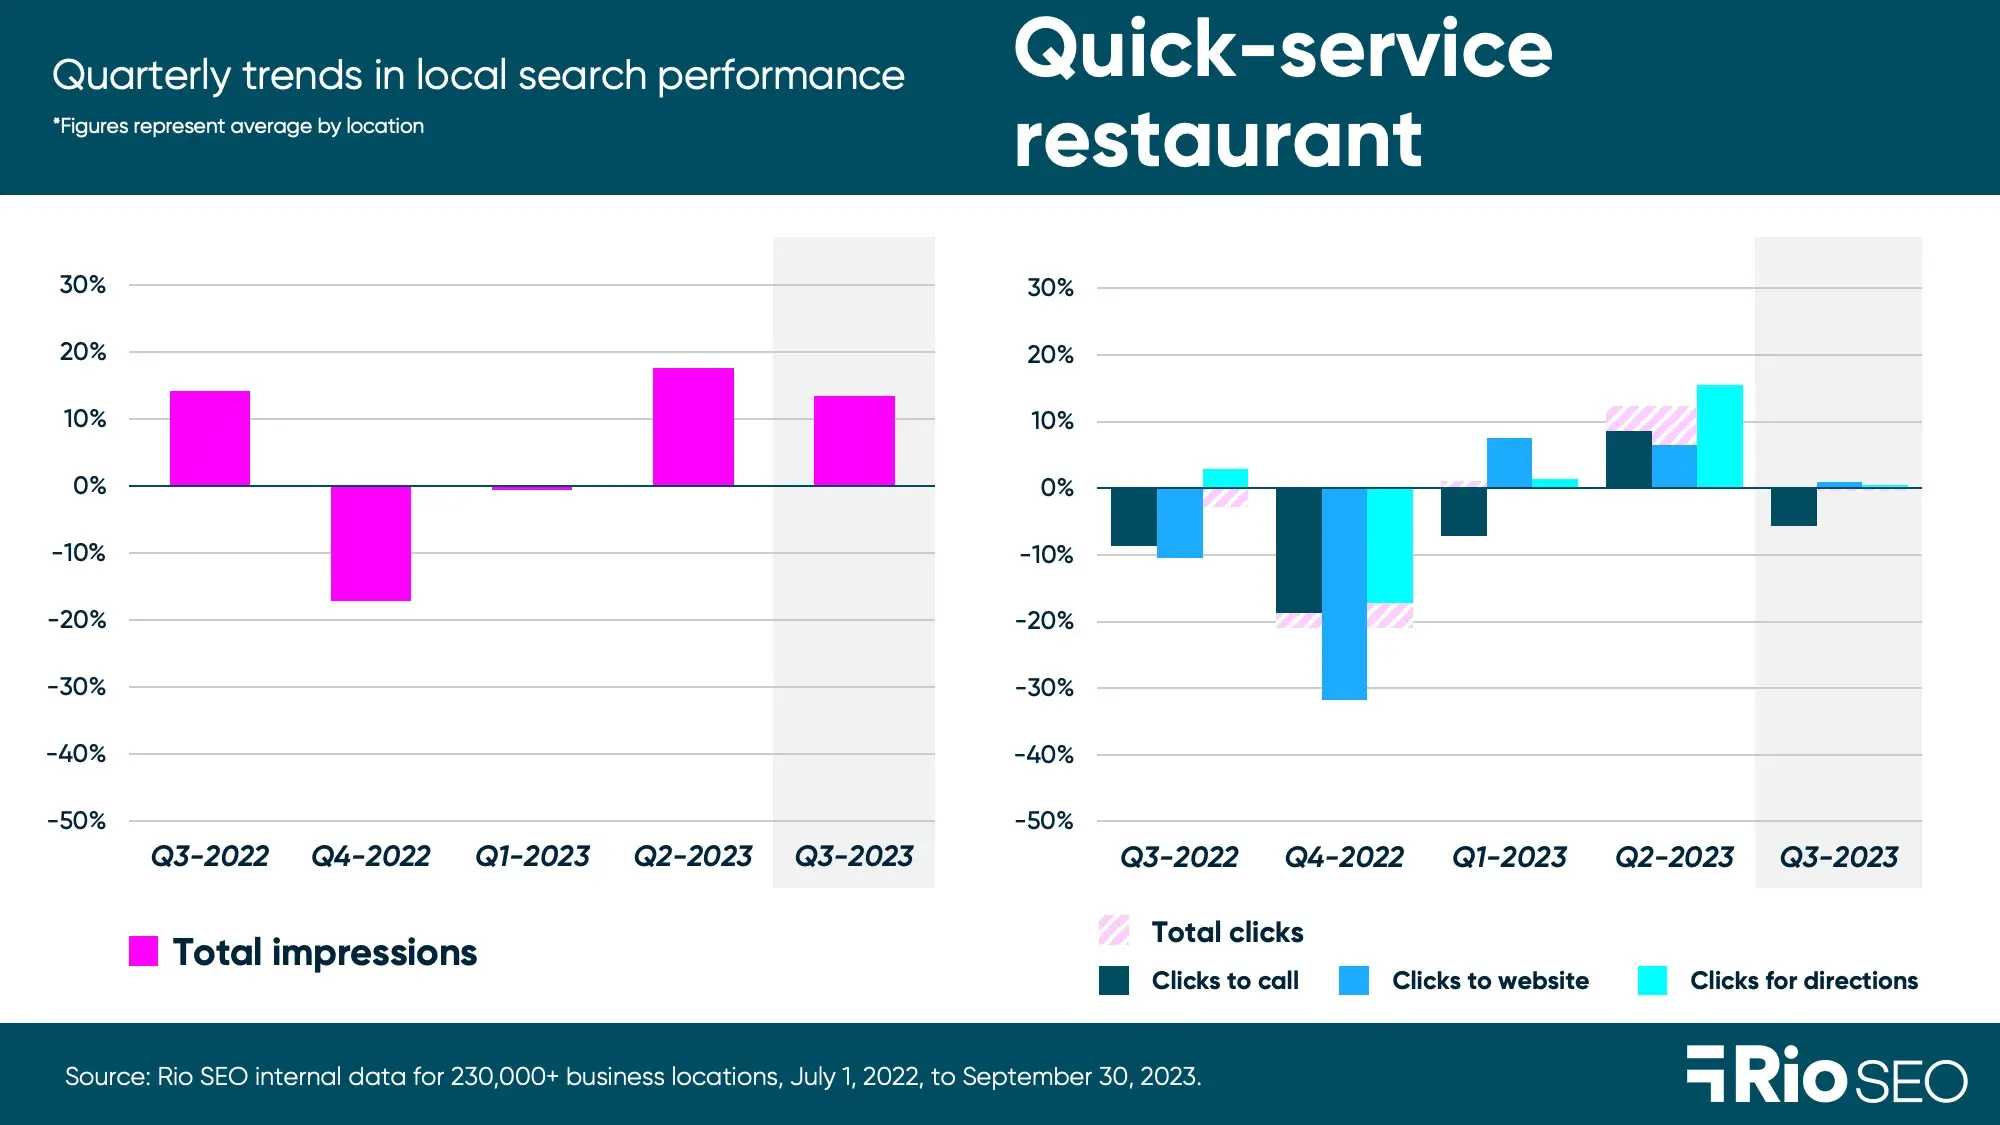
- Total Q3 2023 impressions: +13.5% QoQ and +9.9% YoY
- Total Q3 2023 clicks: -0.4% QoQ and -10.6% YoY
- Q3 2023 food orders: +25.3% QoQ and +100% YoY
- Q3 2023 food menu clicks: +96.8% QoQ and -11.5% YoY
Local search trends for quick service restaurants mirrored those of their full-service counterparts this quarter: growth in impressions (13.5%), and very little movement in clicks (-0.4%), far greater interest in food menus (+96.8%). Total impressions were up +9.9% YoY, while food menu clicks fell -11.5% from Q3 2022.
Hungry diners on the hunt for their next meal don’t want to spend time flipping around from one website to the next, browsing menus. Google enables brands to pull this information right into your listings using its API. Not only can you add the menu item itself, but you can use attributes to provide more delicious details about spice level, pricing, allergens, serving size, nutrition facts, and more.
Now, not all locations are eligible to upload Food Menus. See how to check here whether your restaurants can use this feature, and reach out to the Rio SEO team if you need help.
Hotels
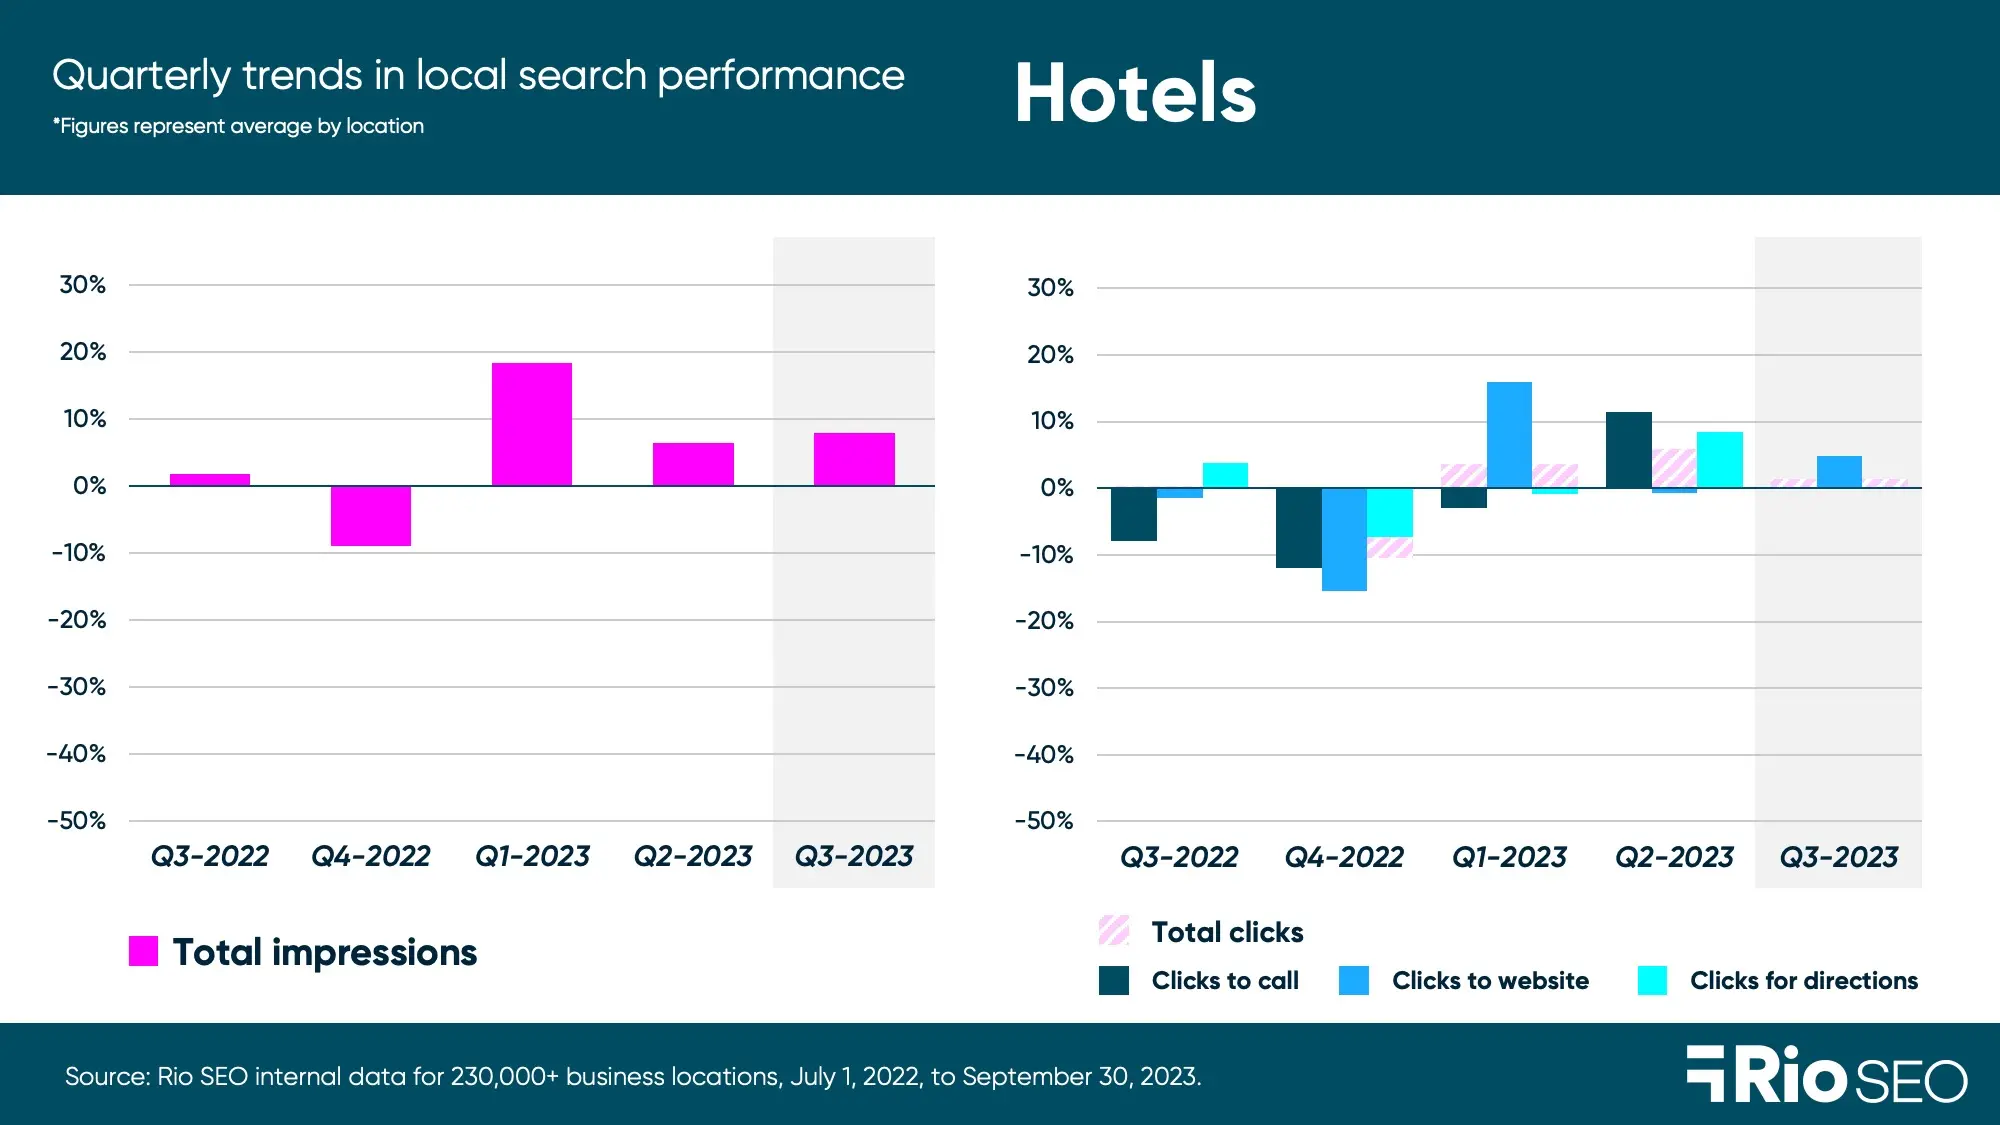
- Total Q3 2023 impressions: +7.9% QoQ and +24% YoY
- Total Q3 2023 clicks: +1.4% QoQ and -0.2% YoY
- Q3 2023 bookings: +174.2% QoQ and +149.5% YoY
Hotels continued to do well in Q3, with total impressions growth of +7.9% building on the +5.6% gain in Q2. Clicks grew to a lesser degree of +1.4% after rising a modest +4.5% from April to June.
When it comes to bookings, it was all good news for hotel brands in Q3, who saw an average +174.2% jump in quarterly bookings via GBP (up +149.5% YoY).
When business is good, local reviews tend to come flooding in. Responding to all customer feedback – positive and negative – is not only a great customer experience but helps your locations perform better in search, too.
Online review management at scale is tough, though. Consistency in brand voice is important, and you definitely don’t want anyone to fall through the cracks. Enterprise brands need systems in place to view, filter, assign, alert, and analyze reviews, converting all review data to actionable insight as you go.
Retail
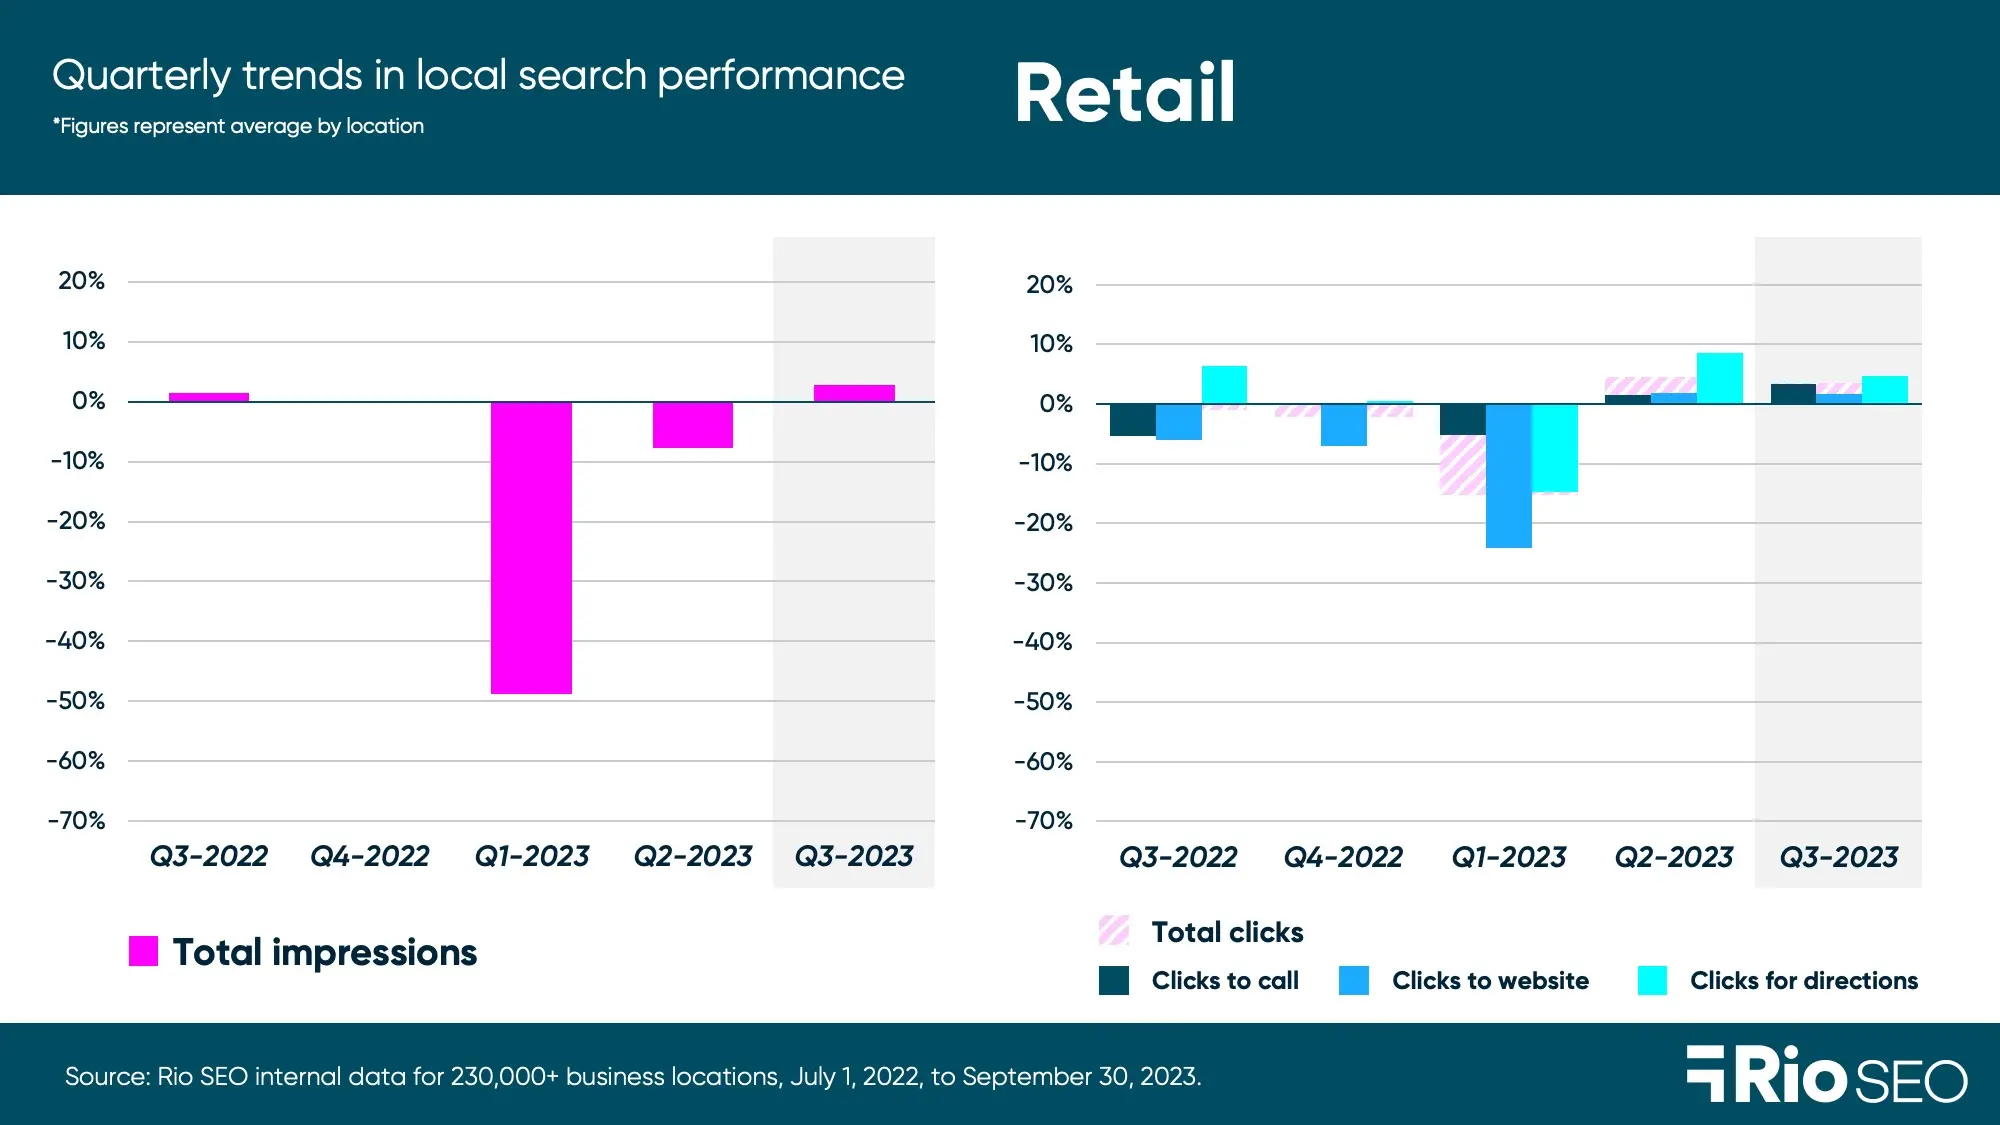
- Total Q3 2023 impressions: +2.8% QoQ and -51.5% YoY
- Total Q3 2023 clicks: +3.5% QoQ and -10.2% YoY
Retail continues to struggle as economic uncertainty and inflation persist. In Q3, we saw total impressions grow +2.8% over Q2, although this is down a staggering -51.5% from the same period one year ago.
Retailers didn’t fare much better when it came to conversions to clicks, with a modest +3.5% quarterly gain building on a +4.3% increase last quarter. Total clicks remained -10.2% lower than in Q3 2022, on average.
In financially challenging times, appeal to budget-conscious shoppers with seasonal sales, timely discounts, and coupons that can be redeemed in-store and online. Brands can support retail locations by publishing offers to Local Pages and distributing approved Google Posts for publication on each store’s profile.
Healthcare
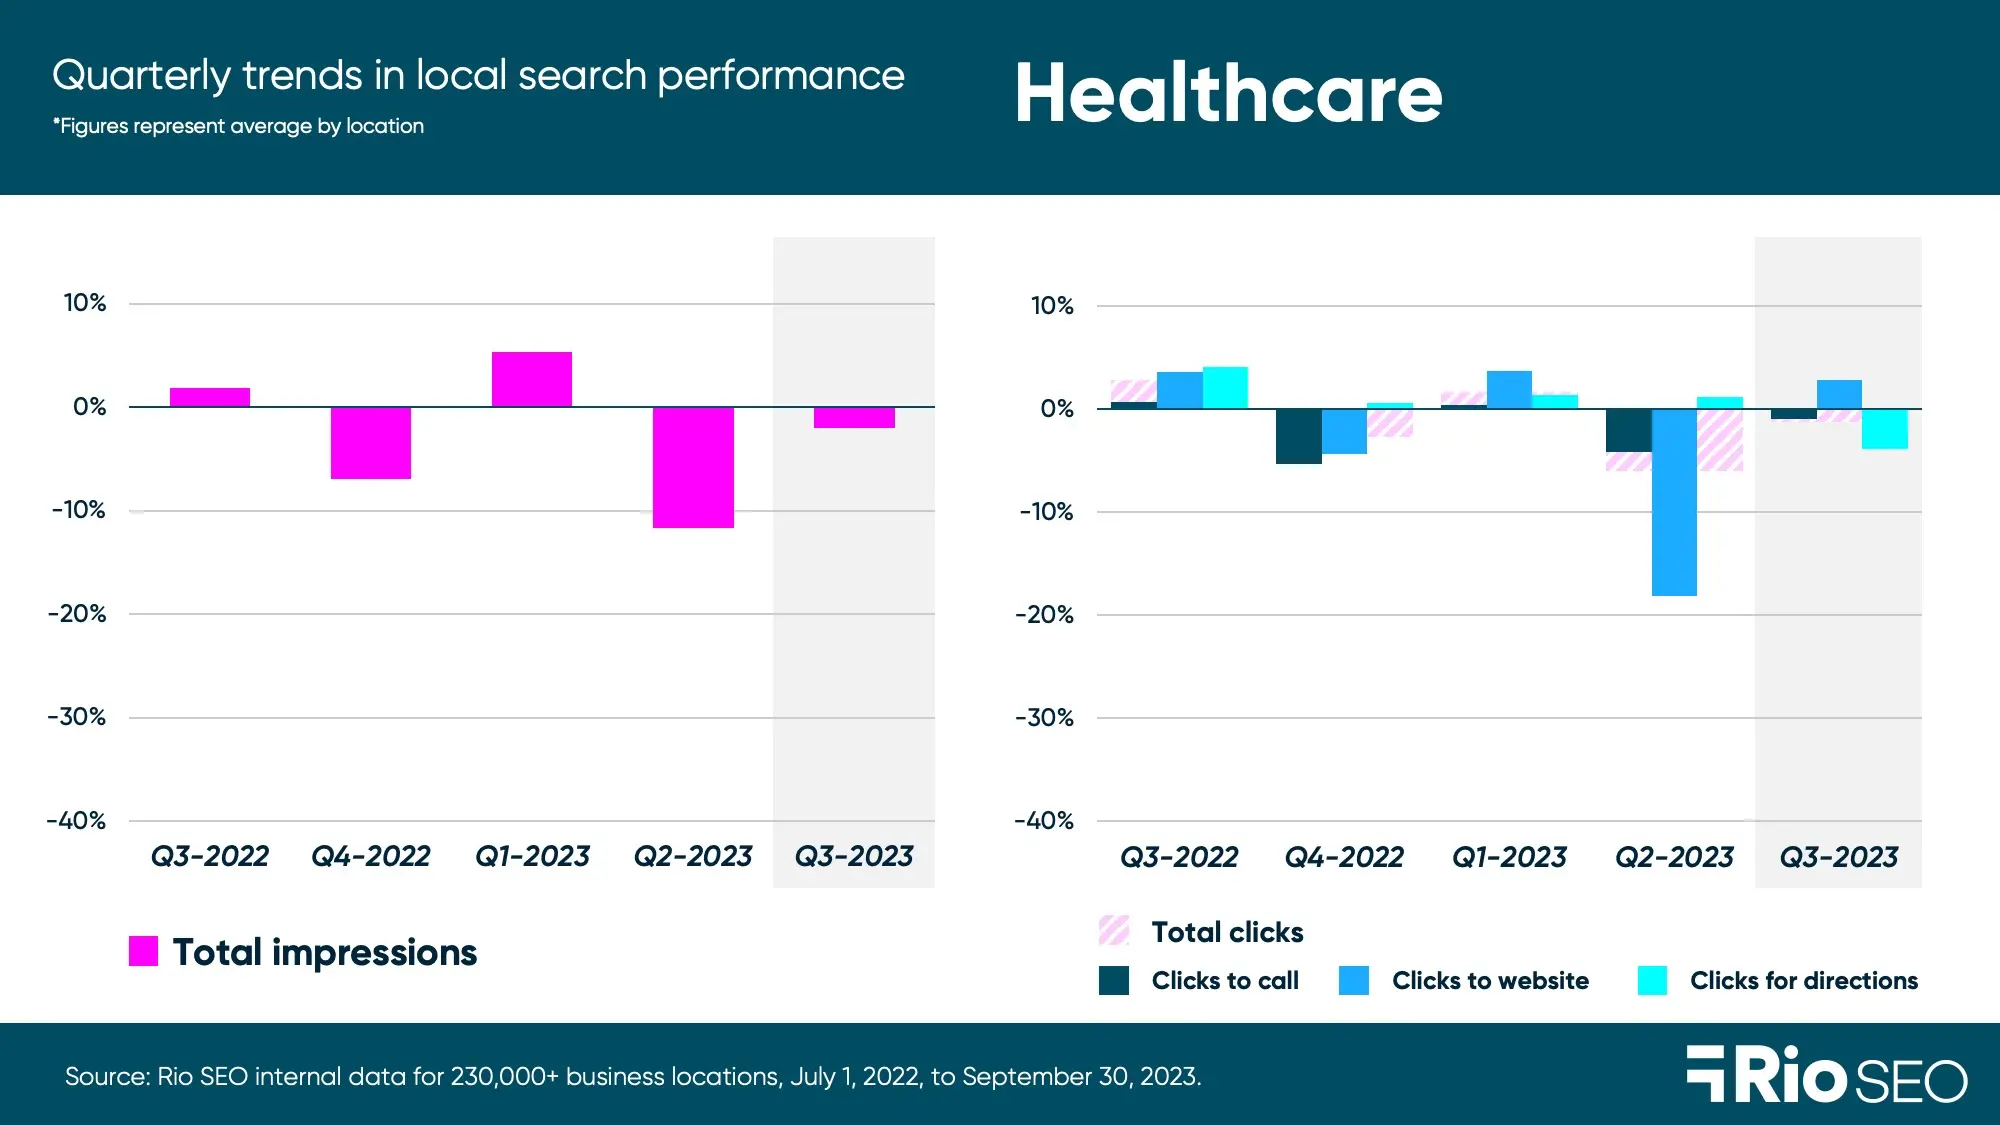
- Total Q3 2023 impressions: -2% QoQ and -15.3%
- Total Q3 2023 clicks: -1.3% QoQ and -8.1% YoY
Total impressions for enterprise healthcare listings continued their downward trend, losing -2% in Q3 after dropping -11.8% in Q2. Clicks fell, too, by -1.3% from Q2 and -8.1% year-over-year.
This may actually spell good news as it indicates healthcare locations are getting a reprieve from the crush of informational requests received during peak COVID breakout and vaccine cycles. This is a good time to review all location listings and ensure they’re accurate, up-to-date, fully optimized, and set up for automated monitoring.
Whether patients find you on Google or Apple, or on healthcare platforms like WebMD, Healthgrades, and Vitals, it’s essential they find the information needed to convert to an appointment booking, telehealth call, or in-clinic visit.
Multi-family residential
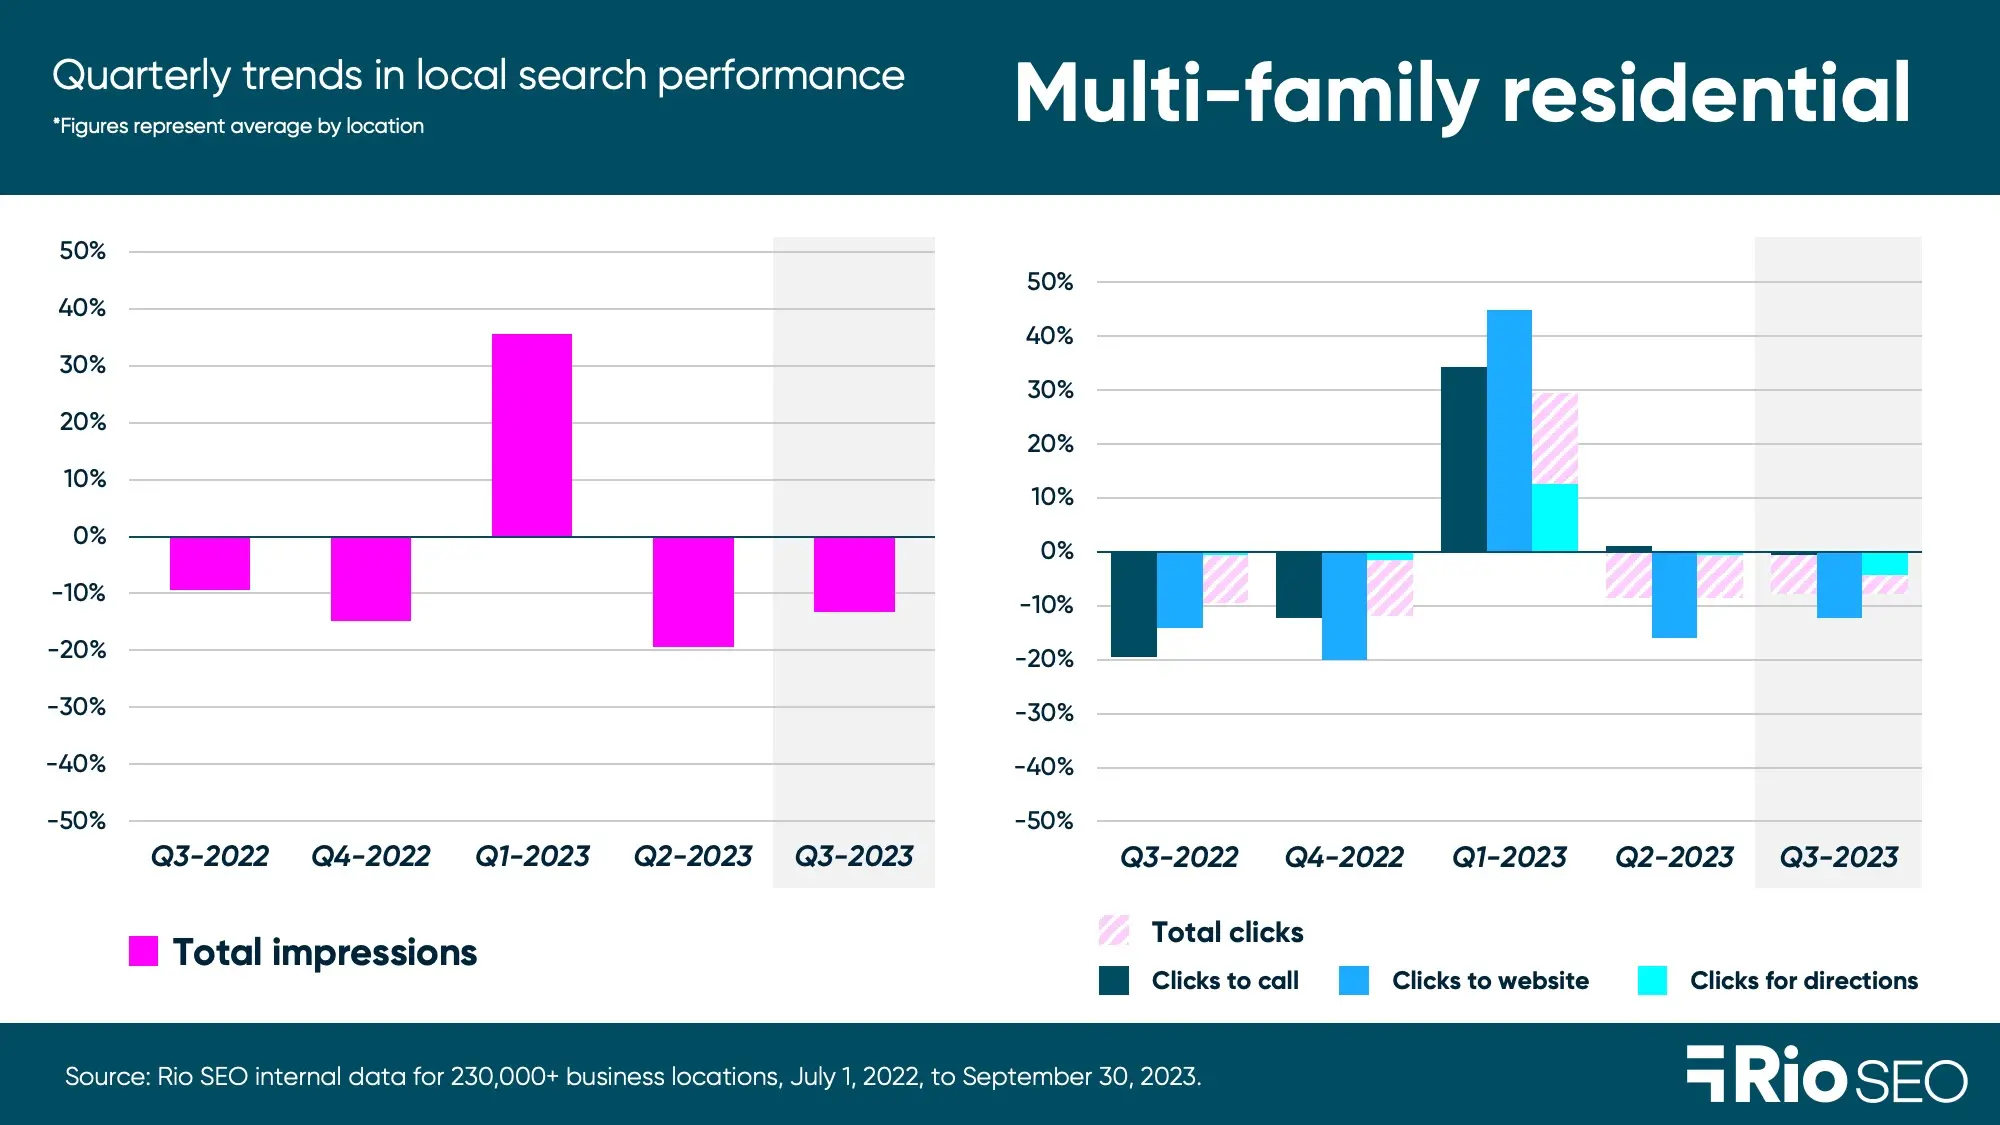
- Total Q3 2023 impressions: -13.2% QoQ and -19.4% YoY
- Total Q3 2023 clicks: -7.9% QoQ and -4.1% YoY
Total impressions fell again this quarter, down -13.2% after sliding 19.5% in Q2. On a year-over-year basis, we see that impressions are down -19.4%. Conversions to clicks have fallen, as well, by -7.9% quarterly and -4.1 compared to the year prior.
Multi-family residential brands have their work cut out for them keeping local listings up to date with beautiful photos that accurately represent each space. Tenants want to see a variety of shots, video, and even interactive tours to help them short-list properties before contacting the company for a viewing.
Getting the right shot is only half the battle, though. Images must be marked up and optimized for search engines to recognize and understand their content, too. Learn more about local photos strategy and services here.
A quick note on how enterprise local search benchmarks are calculated
From late 2020 to December 2022, we aggregated and analyzed GBP performance data from over 230,000+ enterprise brand locations (with 50+ locations) monthly and shared those local consumer search trends on our blog. We transitioned to quarterly reporting for 2023.
One impactful update on Google’s part was how view metrics are calculated for brands in February 2023. Now, only unique views are tracked, so if a searcher views your GBP listings four times in one day, it counts as a single view. Google also removed Total Search metrics and the breakout of search queries by Direct, Brand, and Discovery. Instead, GBP now tracks:
- Impressions – Maps – Desktop
- Impressions – Maps – Mobile
- Impressions – Search – Desktop
- Impressions – Search – Mobile
We’ve combined these into a Total Impressions metric that replaces Searches in our benchmark reporting.
Want to learn more? See our latest in-depth analysis of Google Business Profile trends by vertical, and catch our 2023 Local search ranking factors breakdown webinar on demand now for more insights to fuel your enterprise local marketing strategy.
Related resources

Leading mobility company turns reputation management into a powerful acquisition and revenue driver

evo: Turning reputation into a growth engine
Solotel: Using guest feedback to drive visibility, engagement, and better decisions
Newsletter
Get industry insights that matter, delivered direct to your inbox
We collect this information to send you free content, offers, and product updates. Visit our recently updated privacy policy for details on how we protect and manage your submitted data.