Local Consumer Search Behavior Trends in Q1 2024

Unlocking the power of Google Business Profile (GBP) performance metrics unveils a rich tapestry of customer interactions across your brand’s diverse locations. Rio SEO gives you access to these insights on a granular level, from individual locations to broader regional and brand perspectives. But how do these metrics resonate within the larger landscape of your industry?
Every quarter, we unveil a wealth of insights drawn from meticulous analysis of over 230,000 enterprise business locations spanning eight distinct sectors including restaurants, retail, and financial services. These insights not only enrich your brand’s metrics but also illuminate emerging trends in customer experience (CX), laying the groundwork for innovative strategies in local marketing.
Q1 2024 brought substantially increased local search impressions and clicks for enterprise and multi-location healthcare brands compared to the starting quarter in 2023, while financial services experienced rising clicks to a lesser extent.
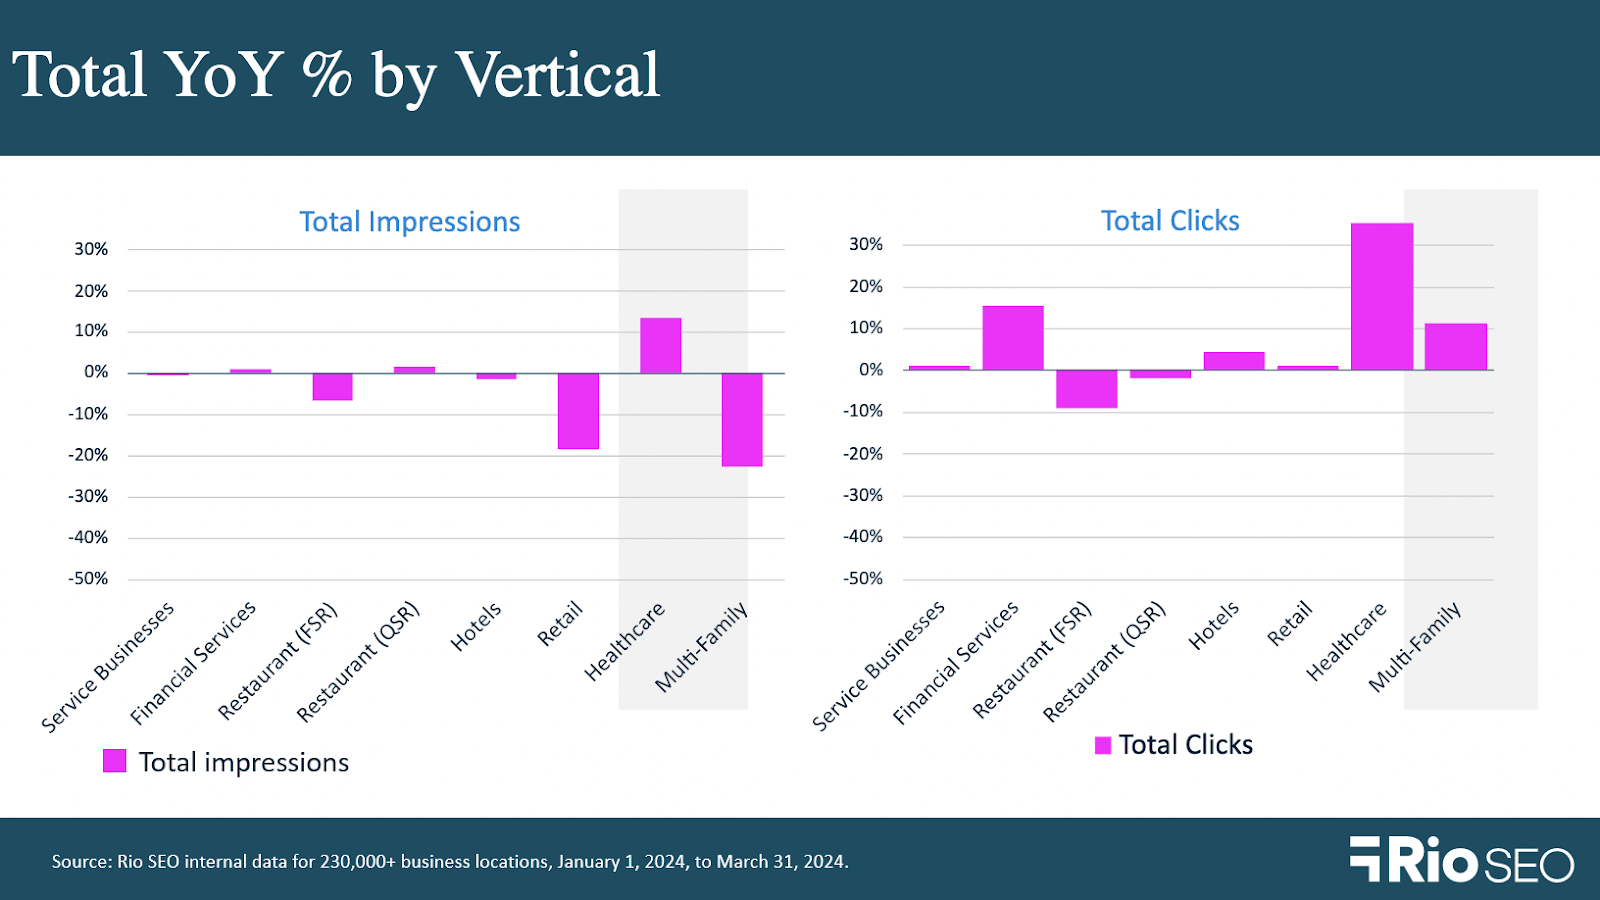
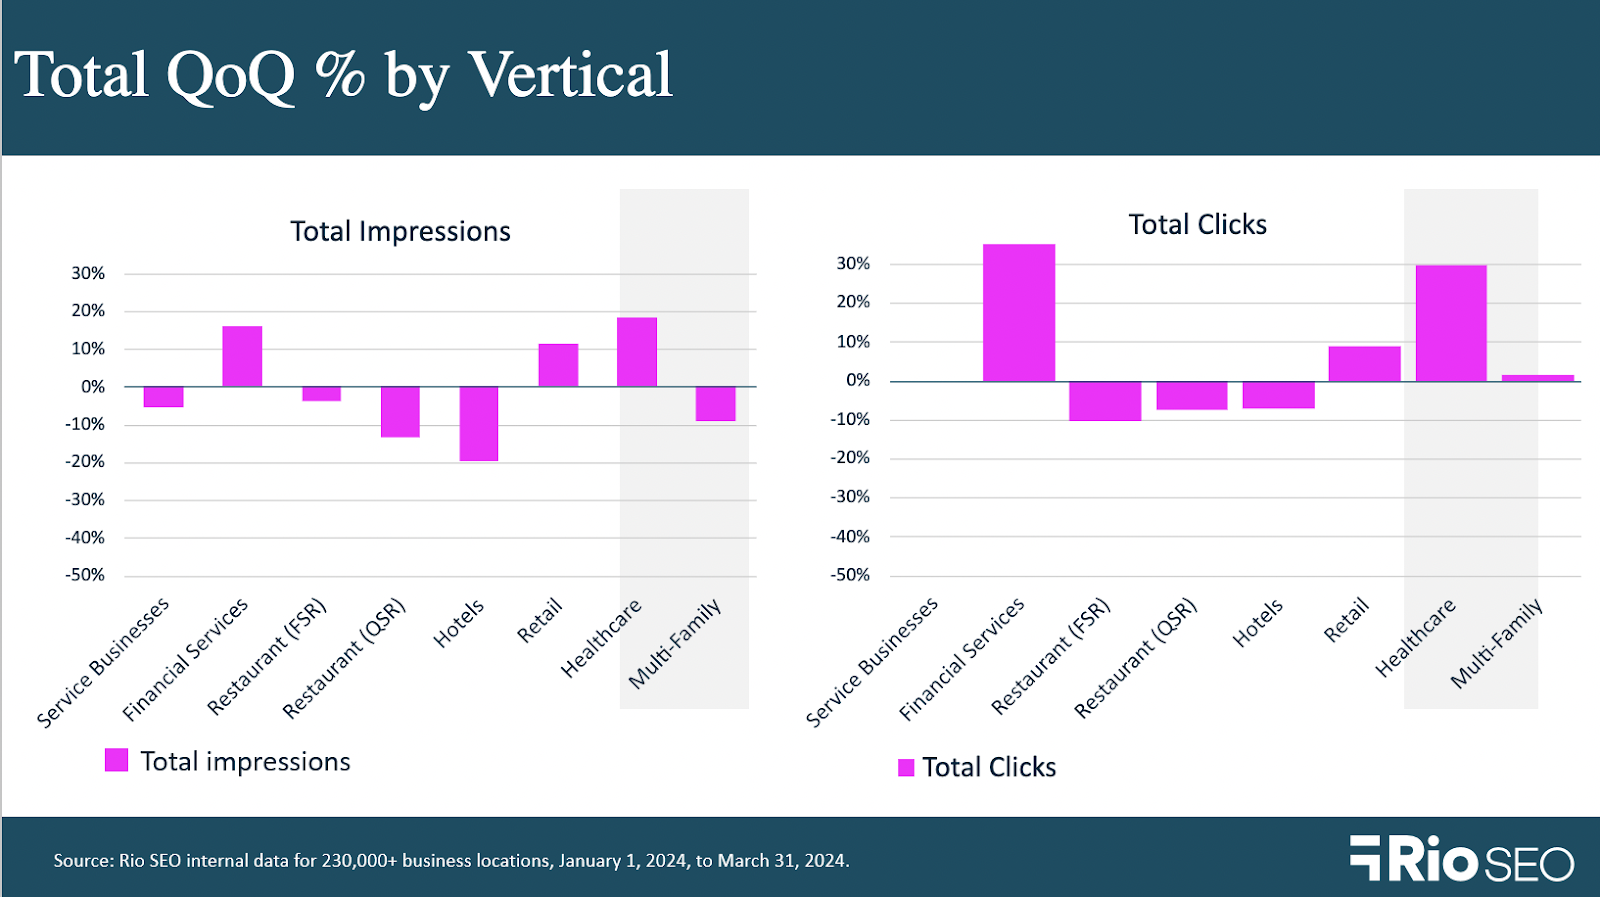
Financial services also saw the greatest movement in clicks on a quarterly basis, with healthcare close behind. Not surprisingly, restaurants, hotels and service businesses experienced the seasonal slump in Q1 that typically follows the holiday season.
Let’s take a closer look at industry-specific insights below. You’ll find tips and expert advice along the way to elevate your local marketing game.
Business services
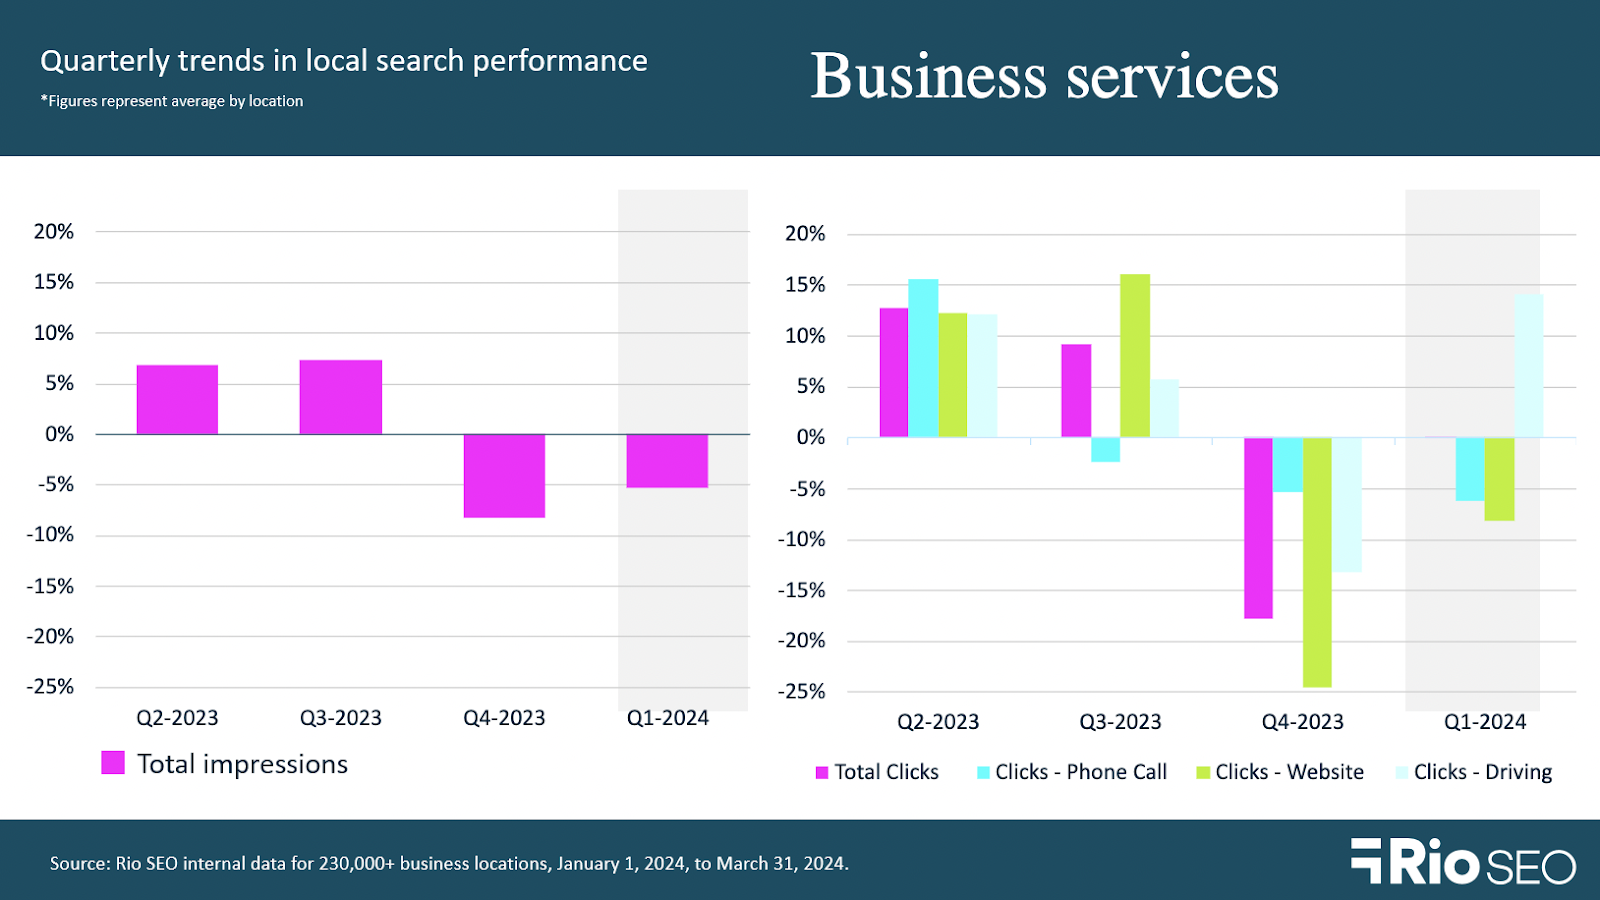
- Total Q1 2024 impressions -5.31 QoQ and -0.52% YoY.
- Total Q1 2024 clicks -0.4% QoQ and +1.14% YoY.
Business services span a wide variety of multi-location enterprises including postal services, IT companies, fitness studios, storage facilities, and more for the purposes of this reporting. In Q1 2024, total impressions for brands in this sector were still lower than in Q1 2023, although to a slightly lesser extent than Q4 2023’s year-over-year losses.
While clicks to call and clicks to website fell slightly from the previous quarter, conversions in the ‘clicks for driving directions’ category made double-digit gains.
Increased foot traffic is good news for the business services sector, as is news that the broader business economy in the U.S. may be stabilizing. Fears of a recession are subsiding as reports show the U.S. GDP gained 3.3% QoQ in Q4 2023 the and U.S. unemployment rate remains near its lowest levels since the 1950s (Brown Brothers Harriman).
Greater foot traffic can bring a higher volume of local reviews, making this a good time for business services brands to evaluate their enterprise reviews program. Intercepting poor experiences before they become negative reviews by way of post-purchase email or SMS follow-up surveys is a good first step. Make sure there’s a process in place for review response across the brand, with templates your local managers and owners can adapt and personalize. Paired with a powerful social listening tool, this not only saves them time and streamlines review responses but also helps create consistency in your brand’s presence across hundreds or even thousands of locations.
Take your reviews strategy a step further by analyzing customer feedback. It takes an AI-enabled tool to do this at scale and glean valuable insights your brand can apply in customers service, operations, product development and more. Learn more about unlocking the voice of your customer with text analysis here.
Financial services
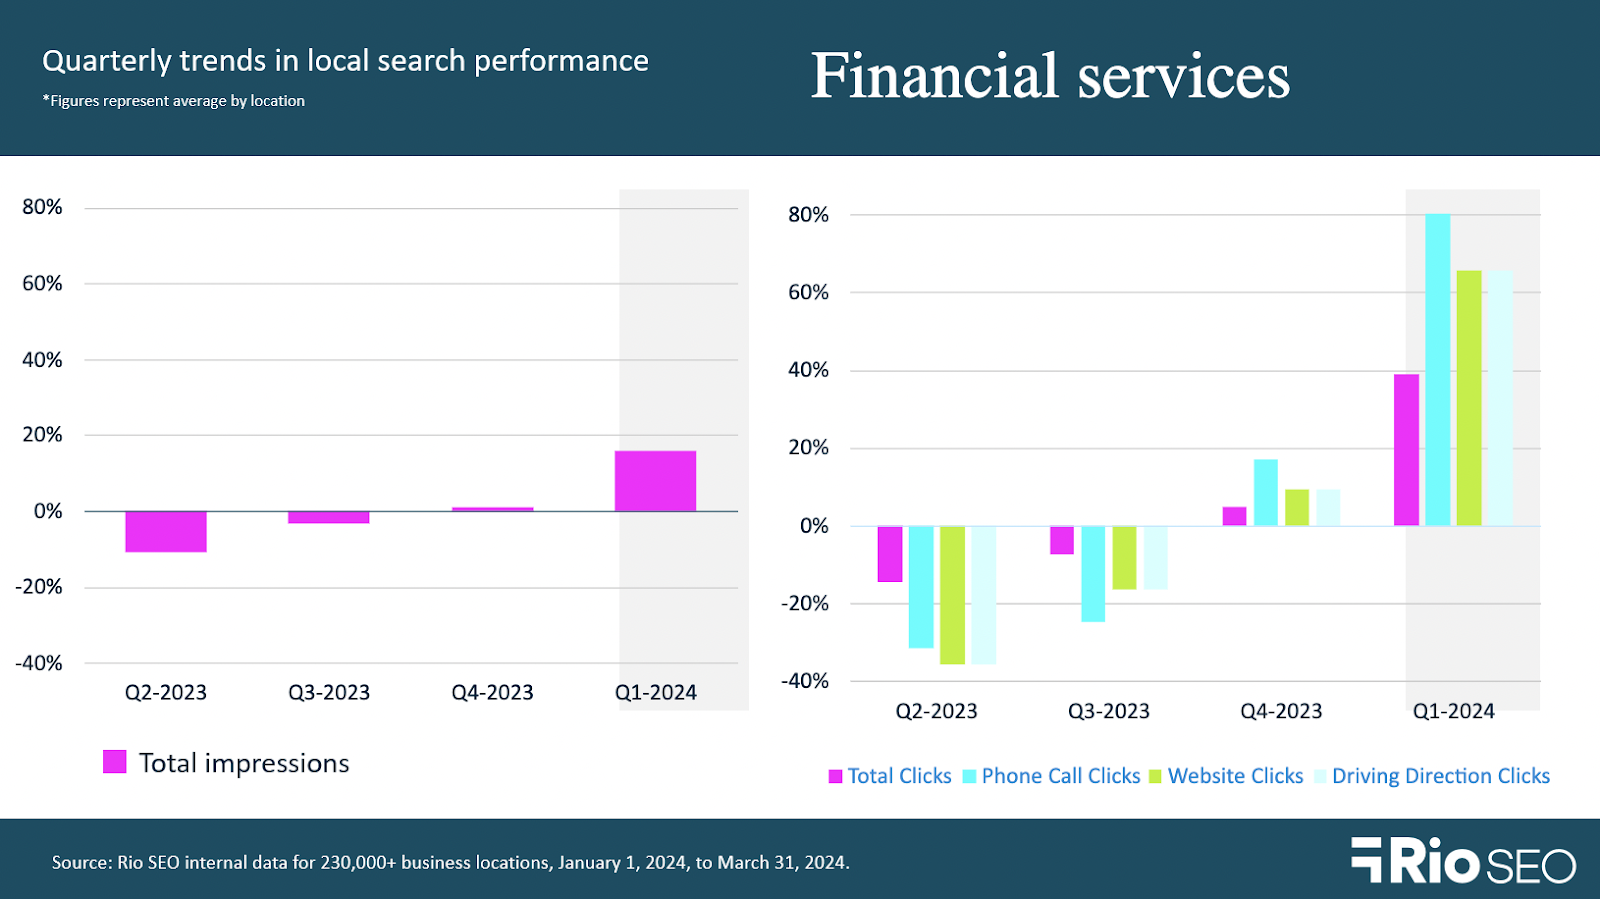
- Total Q1 2024 impressions: +16% QoQ and +0.9% YoY
- Total Q1 2024 clicks: +39% QoQ and +15.3% YoY
Financial services brands include banks, investment companies, insurance agencies, and other financial institutions for the purposes of this research.
In the realm of financial services, trust and brand reputation stand as pillars of success. We’re talking about customers’ perception of your brand, but it’s important to remember that the broader local search ecosystem includes search engines like Google, too. Losing search engine confidence in your brand means locations may struggle to secure visibility in competitive local search results.
Keeping accurate NAP (name, address, phone number) data across all Google Business locations is essential. Our solution for managing local listings is built for enterprise and multi-location brands, proactively monitoring and simplifying the management of NAP information, CTAs, hours, and more across Google Business and numerous other prominent listing sites. With reliable location information wherever customers meet you online, you’ll never disappoint a customer again.
Full-service restaurants
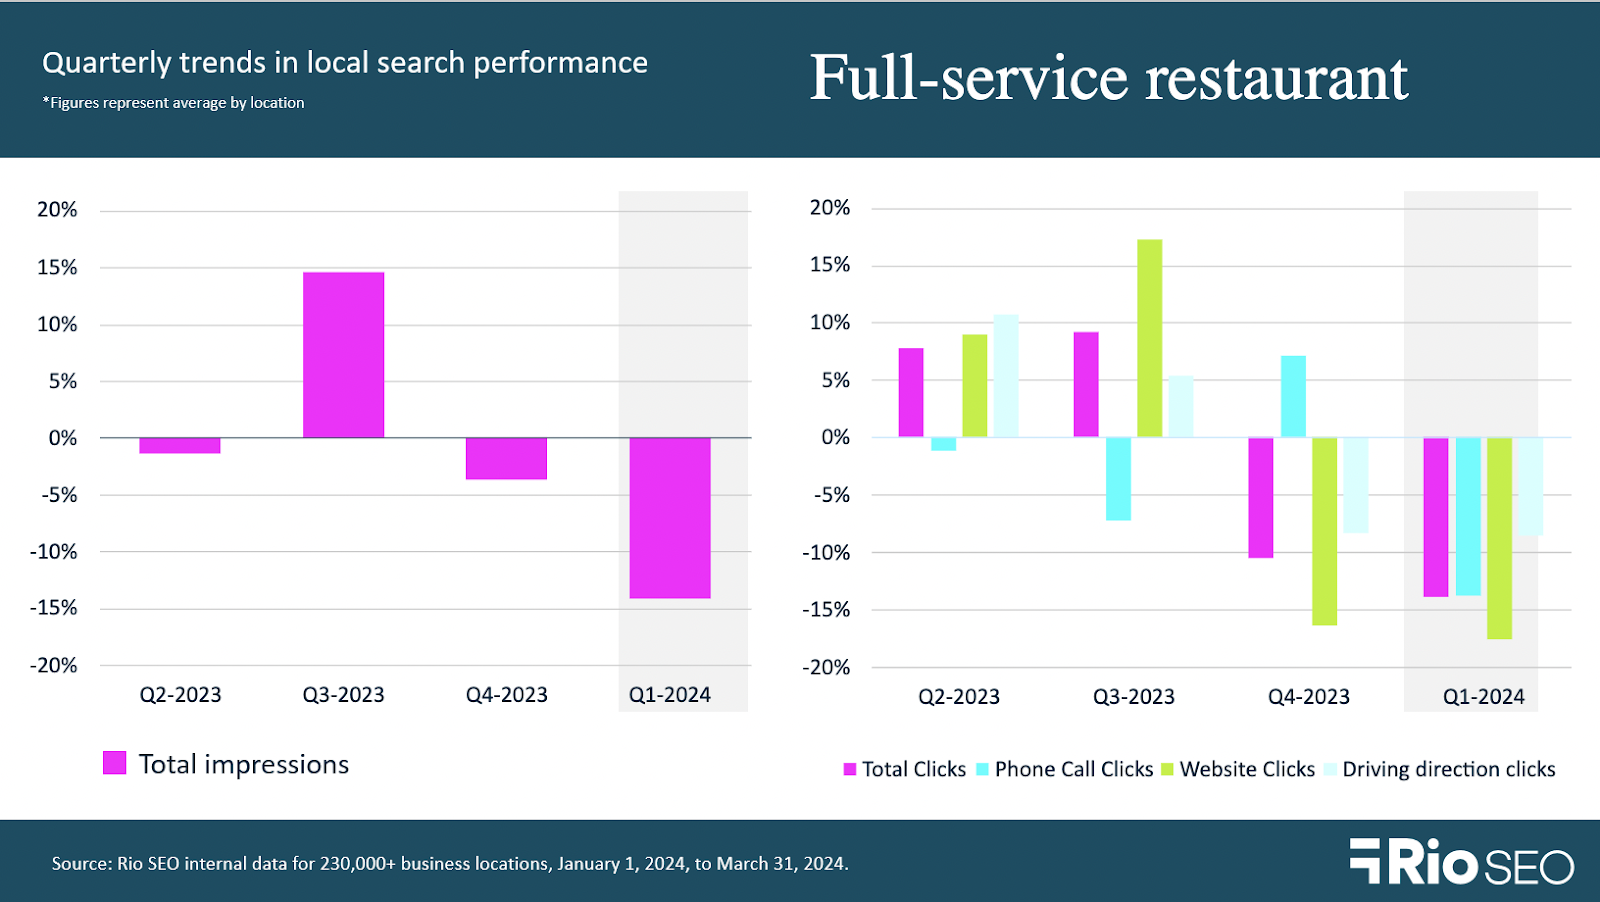
- Total Q1 2024 impressions: -14.2% QoQ and -6.6% YoY
- Total Q1 2024 clicks: -13.9% QoQ and -9.2% YoY
- Q1 2024 food menu clicks -16.6% QoQ and -23.7% YoY
- Q1 2024 bookings: +902.4% QoQ and +654.1% YoY
- Q1 2024 food order clicks: -19.5% QoQ and -49.5% YoY
Restaurants have additional GBP performance metrics to consider since Google added Food Menu, Bookings, and Food order clicks to restaurant reporting. Enterprise restaurant brands saw a dramatic increase in conversions from local search to bookings in Q1, at 654% more than the year prior. However, impressions and clicks were slow, with total clicks falling 13.9% from Q4 ‘23 and down 9.2% YoY.
Despite expert predictions that restaurant sales will hit an all-time high of $1.1 trillion in the U.S. this year, the National Restaurant Association points out that inflation continues to erode profitability. The organization’s recent State of the Industry report says food costs and wages are running about 20% and 30% above the year-ago level, respectively.
Restaurants are also battling the ongoing impact of inflation on customers, many of whom are dining out less – and spending less when they do – due to rising costs of living. These budget-conscious diners are open to deals, with 7 in 10 telling the NRA they often hunt for menu specials or discounts and are willing to go farther if it’ll stretch their dollars.
Use every channel available to deliver personalized, relevant offers to diners in each of your restaurant locations. In addition to promoting them on Google Posts and Local Pages, don’t forget you can add an offer or coupon to your GBP Messaging autoresponders.
Quick-service restaurants
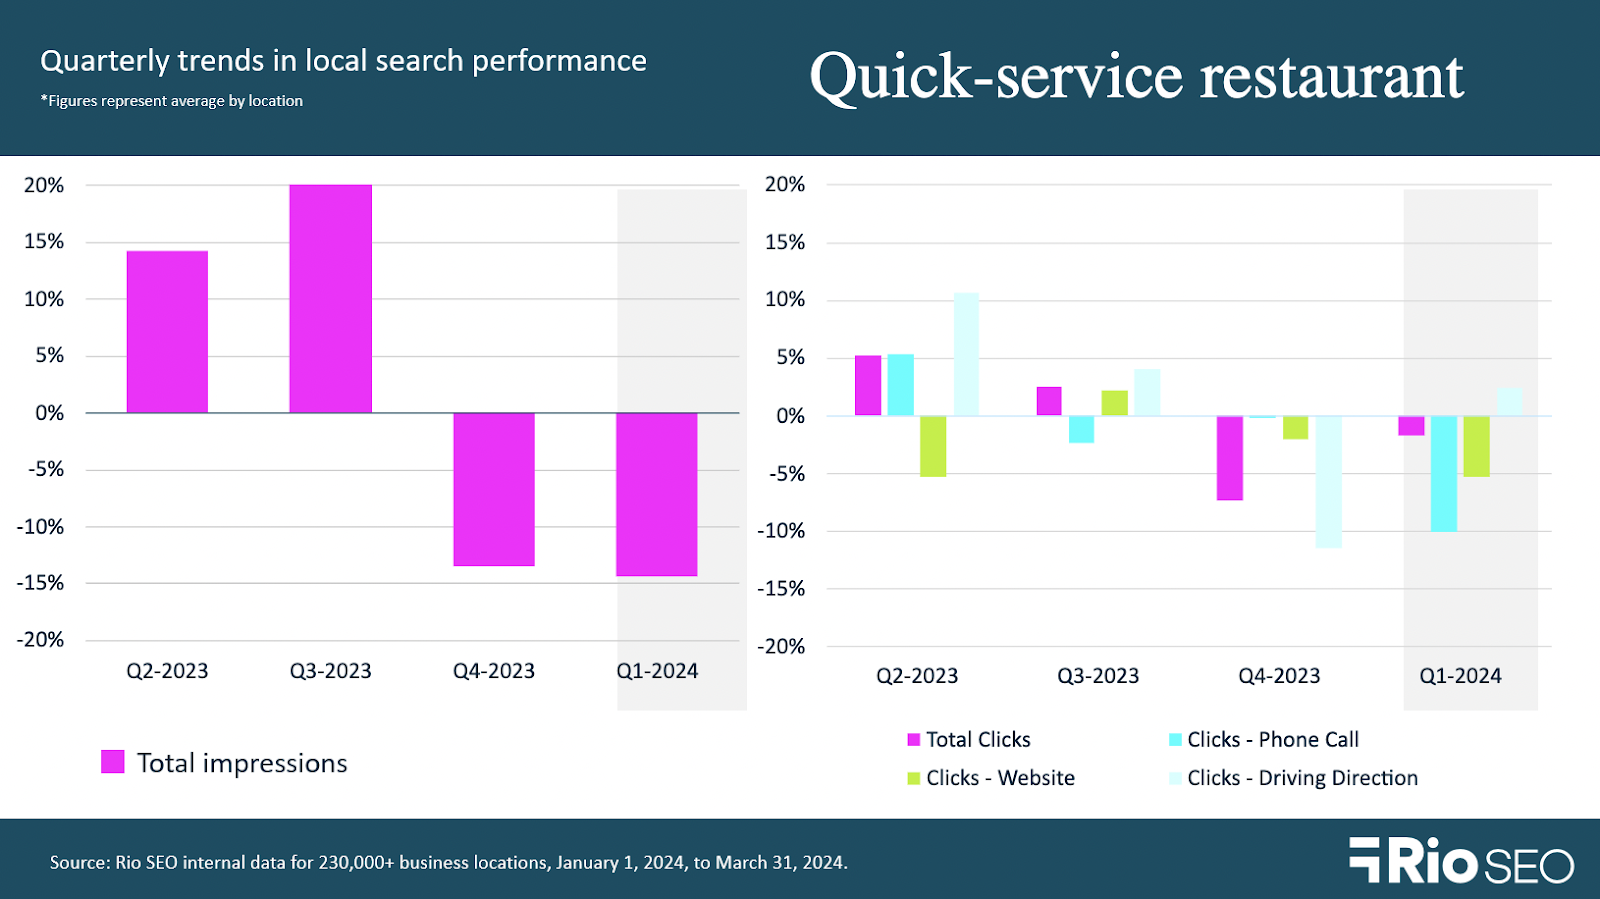
- Total Q1 2024 impressions: -14.4% QoQ and +1.7% YoY
- Total Q1 2024 clicks: -1.8% QoQ and -1.9% YoY
- Q1 2024 food menu clicks: -11.8% QoQ and -23.2% YoY
Enterprise quick-service restaurant trends in local search trend closely mirror those of their dine-in counterparts, with total Q1 2024 impressions down YoY and conversions from local listings down from the previous quarter. However, clicks for driving directions rose slightly from Q4 2023, and though impressions fell from the previous quarter, they settled at 1.7% above the year before.
Restaurant sales growth has been slow in Q1, according to GuestXM by Black Box Intelligence. Same-store sales growth of just 0.1% in March is the weakest in three years, except for January and February 2024. It’s been a rough quarter. Average check growth is slow, too; where 3-4% growth was typical pre-pandemic, March’s check growth rate was 2.5% YoY.
It’s an environment in which customers are seeking value and the best possible experience for their hard-earned dollar, GuestXM reports.
“Connecting restaurant units between Black Box Financial Intelligence and Black Box Guest Intelligence allows us to compare the reviews of those restaurants with the best traffic relative to their local peers with the rest of the field. Not surprisingly, restaurant units with the best traffic growth had better food, service, and value net sentiment scores (net sentiment is the difference between the percentage positive and percentage negative for each category).”
Learn more about mastering and building your restaurant’s local reviews profile here.
Hotels
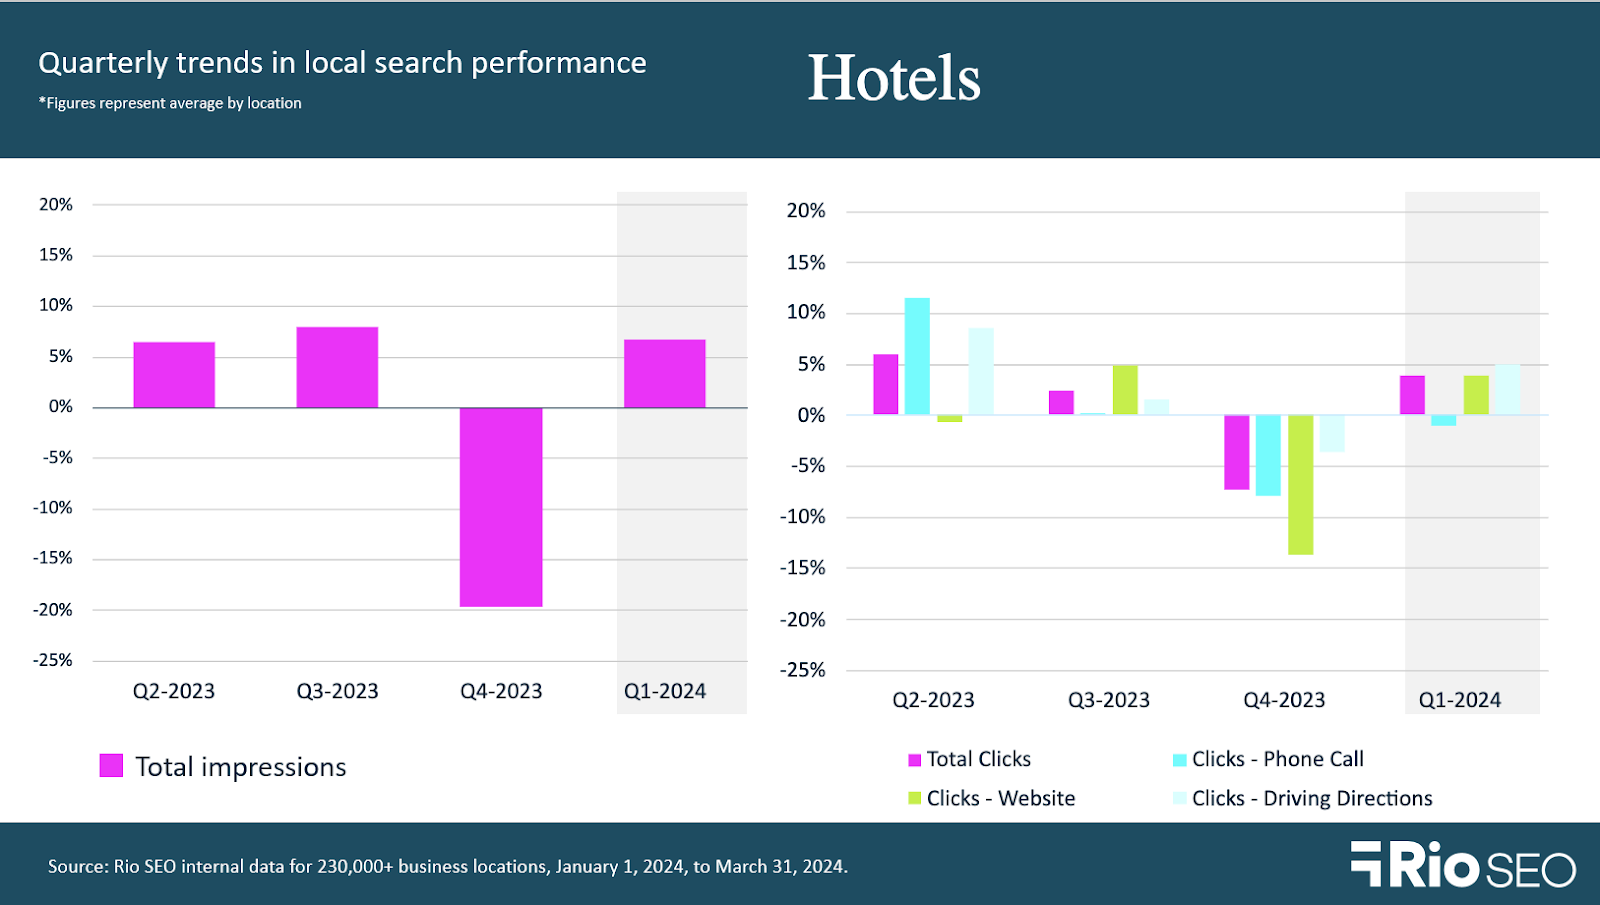
- Q1 2024 impressions: +6.7% QoQ and -1.5% YoY
- Q1 2024 clicks: +3.9% QoQ and +4.3% YoY
- Q1 2024 bookings: -39.1% QoQ and +69.2% YoY
Hotels saw a rebound in total impressions in Q1 after a 19.8% drop in Q4 ‘23. This translated to a 3.9% rise in total clicks, with local searchers requesting driving directions and clicking through on the URL listed on hotel GBPs more often. While impressions were down compared to the year prior, conversions as measured by local search clicks increased.
Guests weren’t using the Booking option on Google listings as often as in Q4 ‘23, although the 69% YoY increase tells us this feature is becoming more popular with local searchers. CBRE reports that revenue per available room (RevPAR) fell in February for the third straight month, and that elevated costs in Q1 meant total revenue growth failed to translate into profits. In February, they reported, short-term rental demand rose 11.7%, outpacing the 1.3% decline in hotel demand by far. Hotel brands are competing online not only against similar properties but also against AirBnB, VRBO, and other short-term rental listings.
In addition to ensuring each location is set up for Booking from search, hospitality brands may want to add Specialty Pages to their 2024 marketing strategy. These dedicated local pages can be used to promote on-site spas, restaurants, golf courses, and other features that differentiate the property, to help it appear more often in relevant searches.
Spring is a great time to update each property’s interior and exterior photos, too. Accurate, current photos across social media accounts, local search listings, booking sites, and webpages help attract bookings and also set the right expectations with guests. Remember, disappointment lies in the gap between expectation and reality. Set realistic expectations with guests, and they’ll reward your brand with positive star ratings and reviews when your team delivers.
Learn more about putting each property’s best foot forward in our free, on-demand webinar, Local Photos: Level up your online presence with images that convert.
Retail
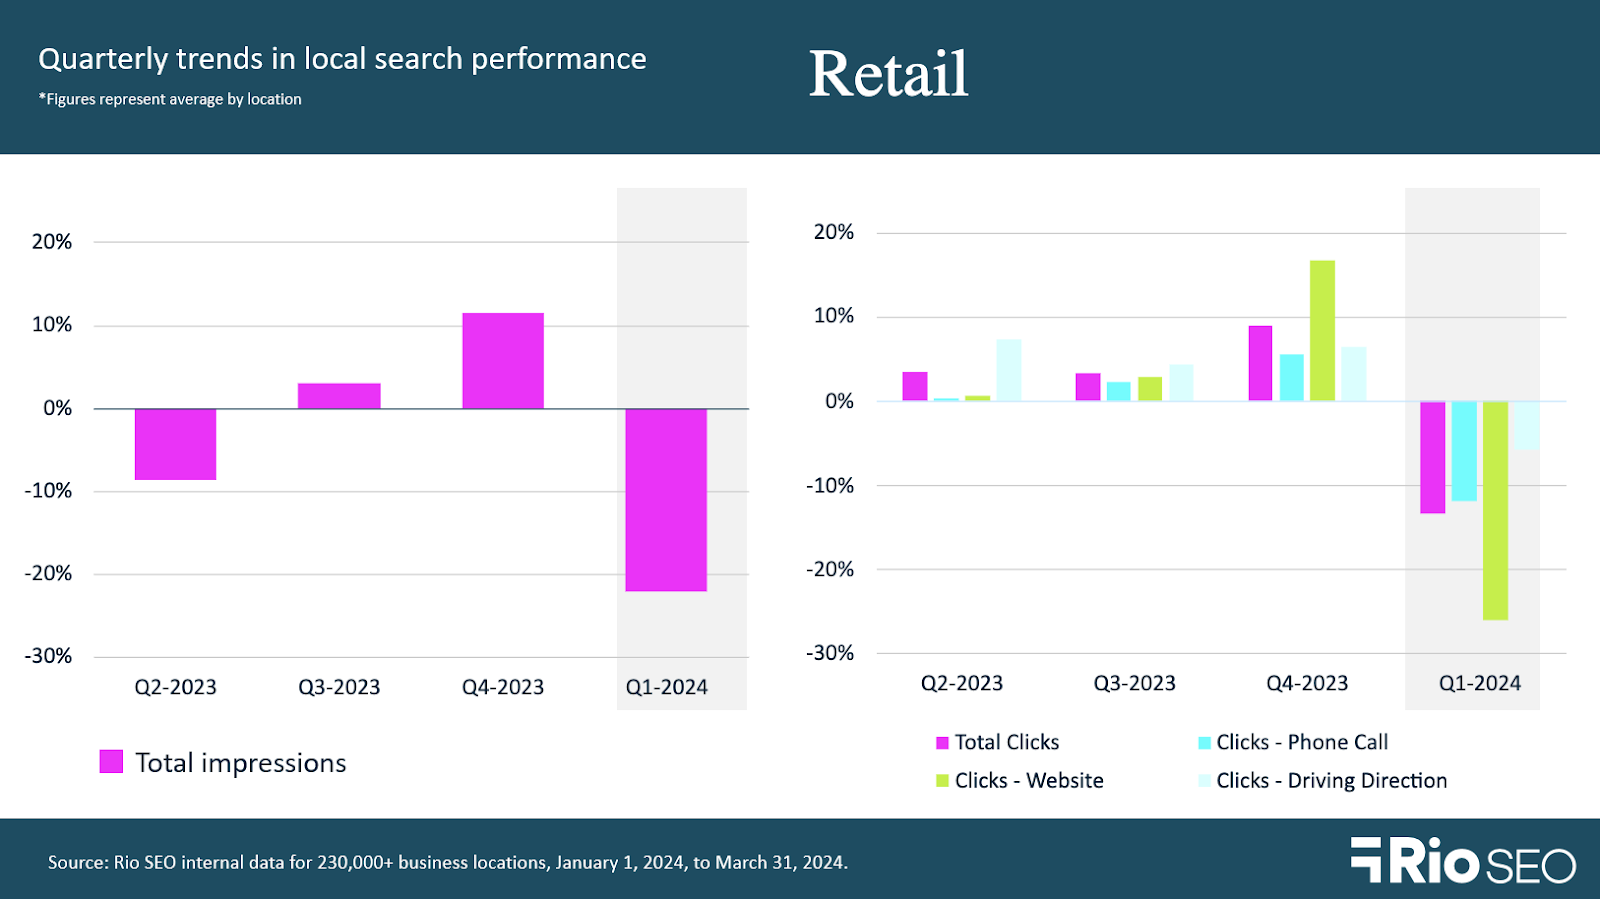
- Total Q1 2024 impressions: -22.1% QoQ and -18.4% YoY
- Total Q1 2024 clicks: -13.4% QoQ and +0.9% YoY
Declines in Q1 local search impressions are no cause for concern. First, they mirror the seasonal trend of a slump in retail activity after the holiday season. But more importantly, U.S. retail sales grew 0.9% in February and 0.7% in March, according to the U.S. Commerce Department’s Census Bureau. Sales jumped 4.0% on a year-on-year basis in March.
Greater foot traffic can drive a higher volume of reviews – particularly when the brand has a post-purchase feedback program in place. Following up after the sale with an email or text message asking customers about their experience is a great way to identify potentially negative experiences before they become low star ratings or reviews left online for all the world to see.
Even if you aren’t asking customers to share feedback, they will; 19% actually prefer writing a review to any other channel when they want to communicate with a brand.
What’s more, the customer feedback gathered in post-purchase interactions is rich in sentiment, suggestions, and insights you can put to work improving experiences across the brand. Download our guide on personalizing the retail customer’s experience – from search to sale to learn more.
Healthcare
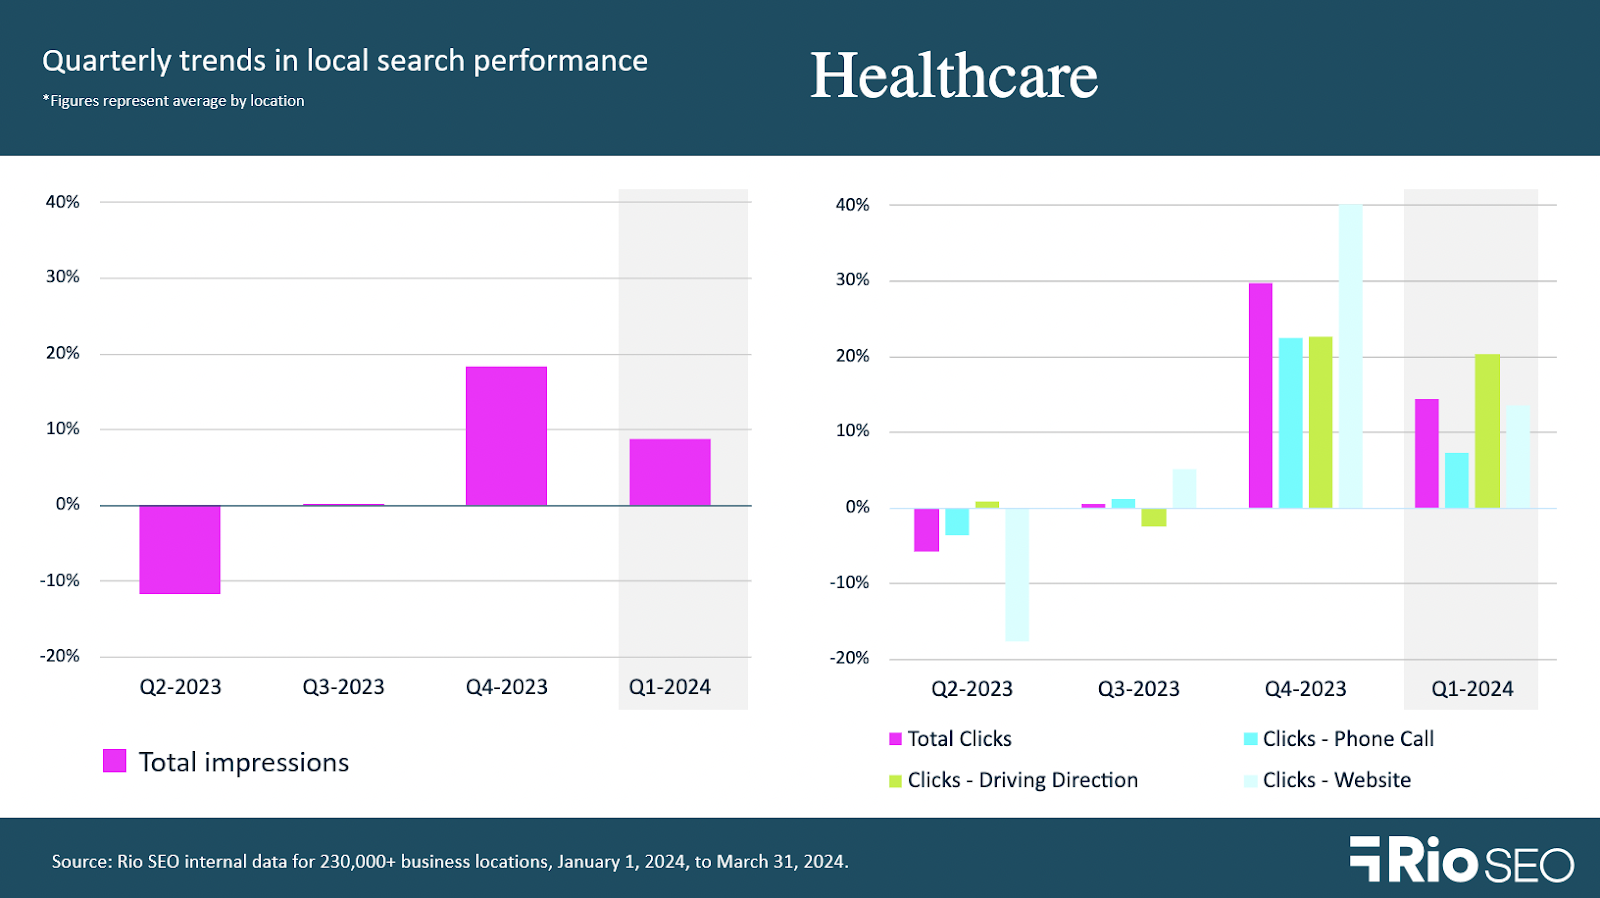
- Total Q1 2024 impressions: +8.7% QoQ and +13.4%YoY
- Total Q1 2024 clicks: +14.3% QoQ and +40.3% YoY
In Q1 2024, healthcare brands saw continued growth in local search performance, building on gains made in Q4 ‘23. Total impressions were up 8.7%, and clicks rose 14.3% on a quarterly basis, with clicks for driving directions the leading conversion type from GBPs.
Accurate, complete local listings are essential for all types of business, but perhaps none more so than in healthcare. Positioning your hospitals, clinics, services, and medical specialists to be found when patients are in need is not only good customer service but could impact a person’s well-being or even save a life. Directing customers to an old address or a closed clinic could have disastrous consequences.
Using a local search solution built for large organizations with many listings enables you to proactively monitor for any discrepancies, and to push correct information live across multiple profiles when things change. Be sure to choose a solution with built-in local reviews monitoring and response features, to stay tuned in to patient feedback as it happens.
Remember, listing inaccuracies can happen in countless ways. Clinicians change locations. Offices close and relocate. Facilities change their hours of operation. Patients can even create new business profiles accidentally when trying to leave reviews on social media, search, or maps. Local listings are dynamic and constantly updating – and they’re often a patient’s first point of contact with your brand. Make the right first impression, and win more of those searchers over as booked patients.
Multi-family residential
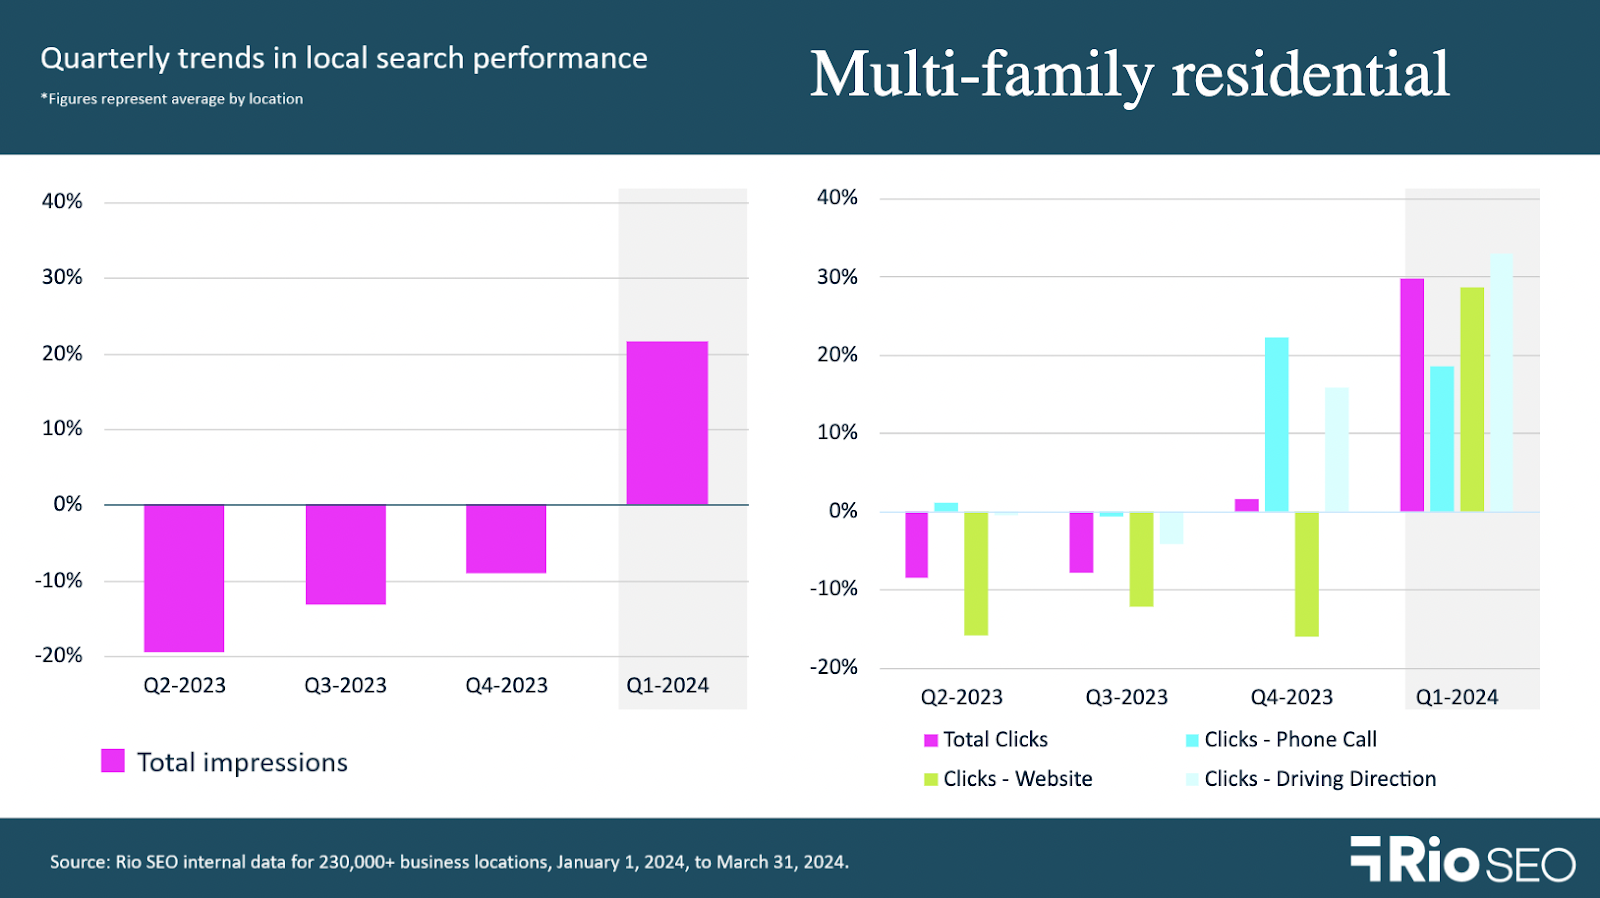
- Total Q1 2024 impressions:+21.5% QoQ and -22.8% YoY
- Total Q1 2024 clicks: +29.8% QoQ and +11.1% YoY
Q1 2024 brought a flurry of activity for multi-family residential brands across the U.S., with a 21.5% quarterly increase in local search impressions driving 29.8% more clicks to Google Business Profiles. All types of local search conversions grew by double digits, with clicks for directions leading the way.
Apartments.com data suggests that growth in vacancy rates is slowing, as an increase of 7.8% in March was the smallest increase of the last 10 quarters. “Renters are searching for apartments again, which is helping to balance the vacancy rate,” their report notes.
What do motivated renters see when they find your properties in search – and are you positioned to be found at all?
Google considers a variety of factors in its local search rankings. Relevance, distance, and prominence all play a role, with local listings accuracy and local reviews being two factors in particular to watch. Search engines want to provide users with the best possible response, and that means displaying results that are accurate, trustworthy, and relevant to the query. Google isn’t the only game in town, either – read our Apple Connect guide to expand your brand’s online presence in Apple Maps, too.
Looking for more data-backed insights to fuel your local search strategy? Download our ‘2024 Local search consumer behavior study’ to get the latest trends in search discovery, online reputation, and customer experience insights.
Related resources

Leading mobility company turns reputation management into a powerful acquisition and revenue driver

evo: Turning reputation into a growth engine
Solotel: Using guest feedback to drive visibility, engagement, and better decisions
Newsletter
Get industry insights that matter, delivered direct to your inbox
We collect this information to send you free content, offers, and product updates. Visit our recently updated privacy policy for details on how we protect and manage your submitted data.