Local consumer search behavior trends in Q1 2025

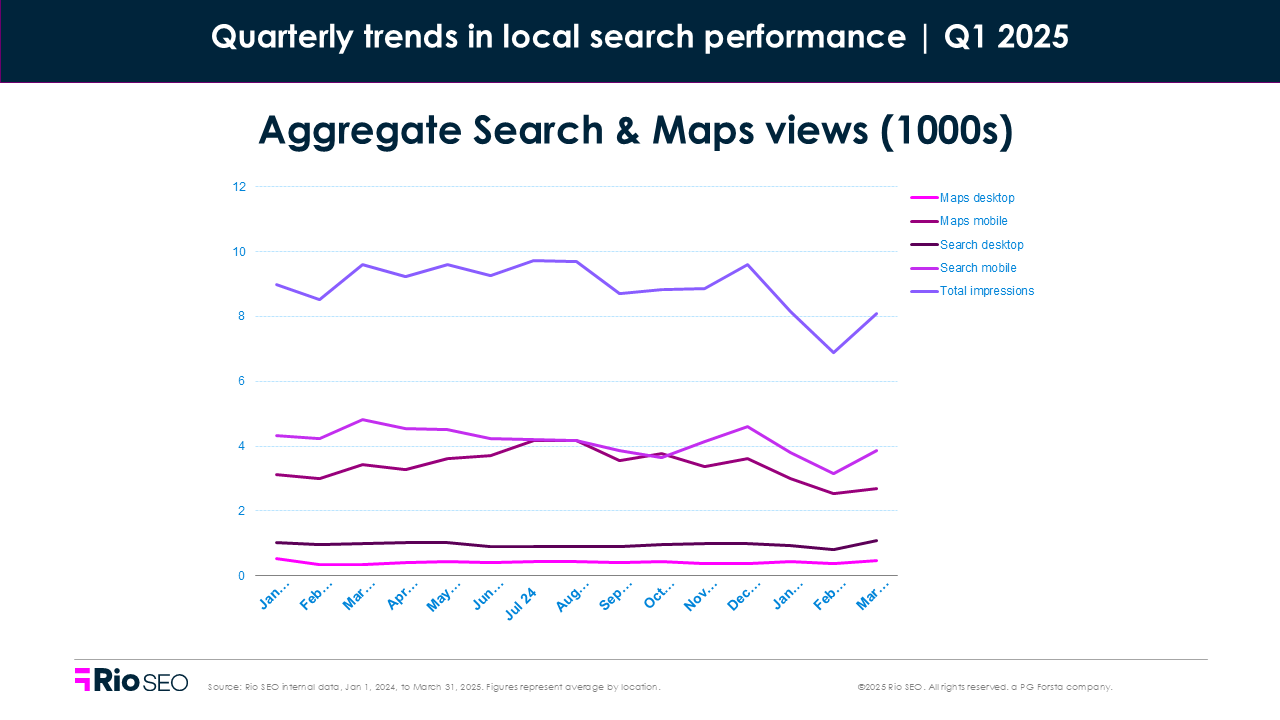
Google Business Profile (GBP) metrics reveal a more comprehensive story than just views and clicks. They capture how people discover and engage with your brand, from the initial glimpse in a search result to the final step through your front door.
These local signals shape the customer experience (CX) at every location in your network. That’s why each quarter; we dig into Google Business Profile performance trends across more than 230,000 enterprise business locations in seven industries.
This quarter comes with a caveat. In early January, a Google algorithm update led to an artificial spike in directional clicks for physical locations and a sharp decline for people-based listings. The impact lasted about 10 days, but it skewed directional click metrics for the entire quarter. If you see an eye-popping YoY change in direction clicks, this is why.
We suspect a mix of Google’s AI Overviews prevailing, search engine results pages (SERPs) layout shifts, and declining “near me” queries played a role. The net result is a bit of anomalous behavior that will likely normalize over time but muddies the Q1 waters a bit.
Still, Q1 2025 presents us with plenty to discuss. From financial services facing continued friction in clicks to restaurants riding seasonal tailwinds, each industry has its own local story to tell. Let’s take a look.
Year-over-year local search trends
Healthcare came out on top in Q1, with views up +13.5% and website clicks rising +21% year over year, driven in part by strong mobile Maps performance. Hospitality also held steady, posting +7.8% growth in website clicks and an +11.7% bump in bookings, despite flat views.
But for most industries, the story was about contraction. Restaurants saw the steepest drop in visibility (-38.2%) and engagement, with food orders down -40.4% and menu clicks off -33.3%. Multi-family residential and financial services also faced sharp YoY declines in total clicks (-23.0% and -15.7%, respectively), with phone inquiries falling fastest.
Retail and service businesses experienced milder slowdowns. Direction clicks were the hardest hit across the board, particularly for retail (-20.7%) and service brands (-21.7%), likely reflecting shifts in how users navigate or interact with listings.
Quarter-over-quarter local search trends
Q1 2025 shook things up across local search. Healthcare stayed strong; views were up +6.3% and website clicks rose +7.4%, pointing to steady demand for appointment-based care. Hospitality also bounced back. Bookings jumped +12.7% and mobile search views soared +64.9%, even as overall views slipped.
Retail didn’t fare as well. Views sank -23%, with sharp drops in map views and driving direction clicks—suggesting shoppers may be skipping store visits. Restaurants continued to slide, as well: visibility dropped -17.2%, food orders tumbled -41.5%, and mobile Maps views cratered -40.1%.
Meanwhile, financial services and multi-family brands both saw viewership drop, but with some bright spots. Financial brands drove a +19.8% lift in direction clicks, while multi-family search views climbed +23.8% — proof that high-intent local actions are still happening, even when overall visibility dips.
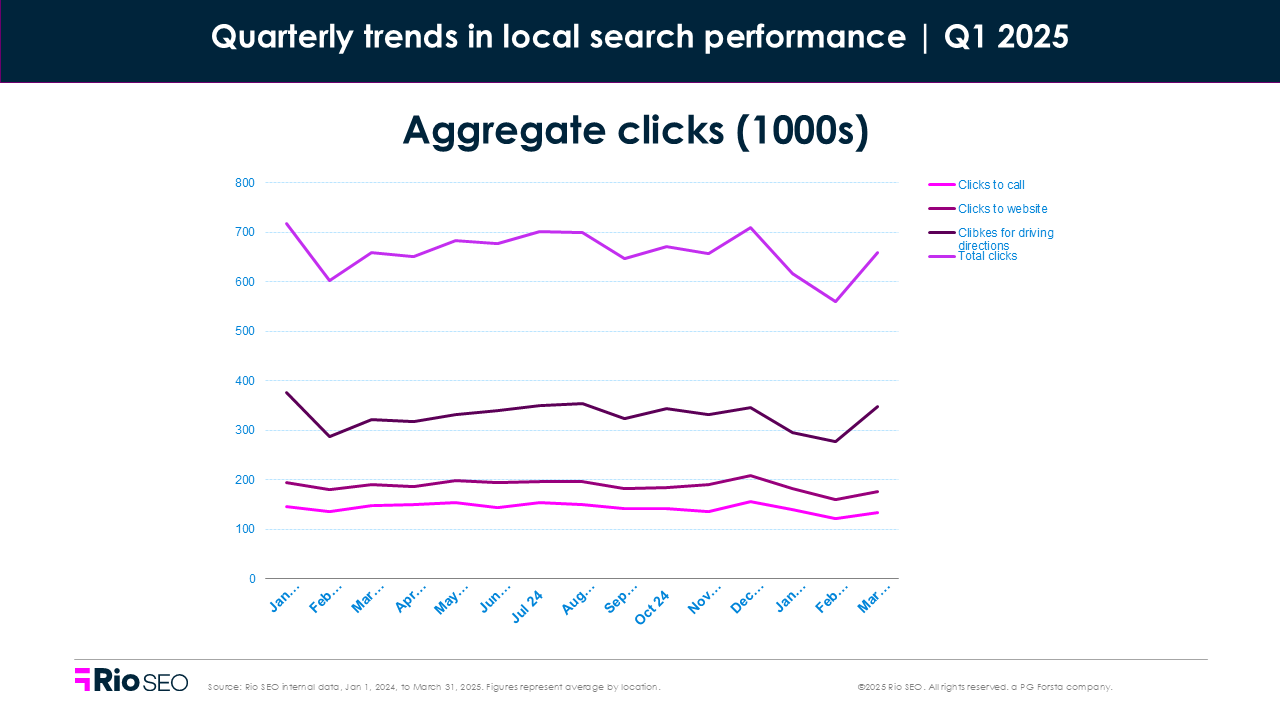
These shifts underscore one thing: not all clicks are created equal. Focusing on meaningful actions, such as direction requests, website visits, or conversions, gives brands a sharper understanding of what’s working and what needs improvement.
Below, you’ll find vertical-by-vertical insights that spotlight what’s shifting (and what’s sticking) across the local search ecosystem. Keep an eye out for actionable tips and expert advice to help you fine-tune your strategy where it matters most.
Retail
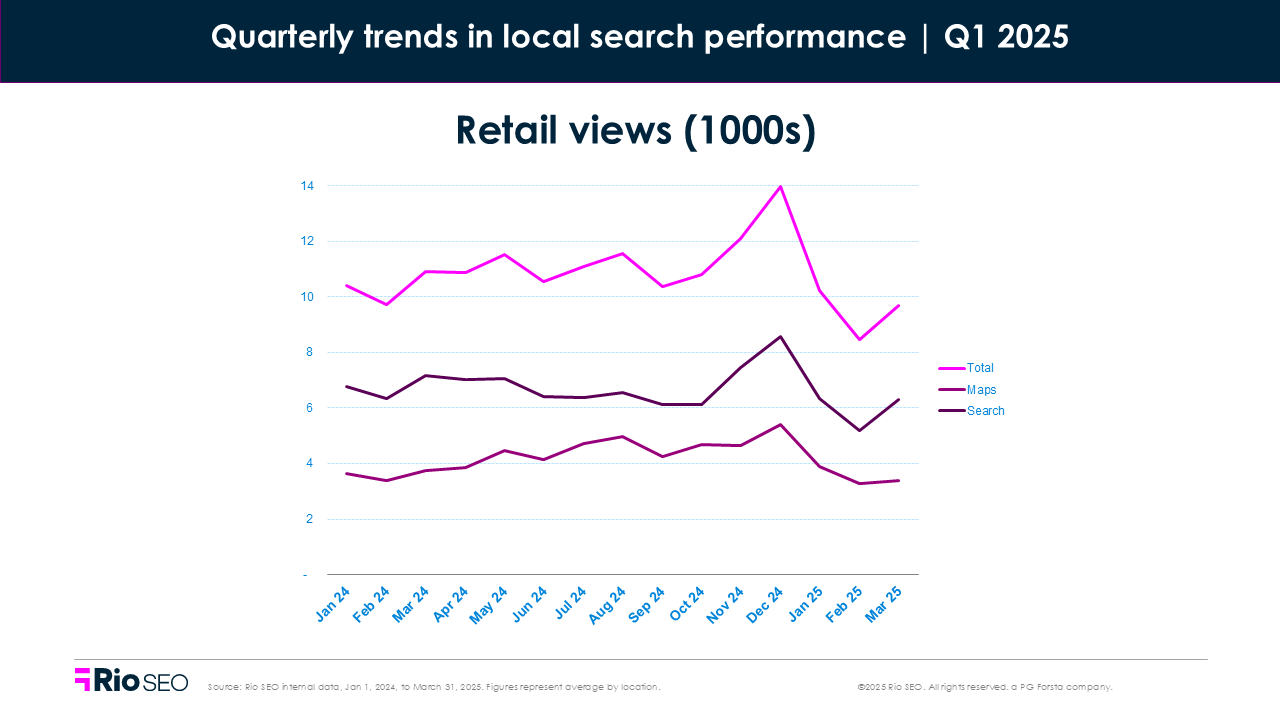
Total Q1 2025 views: -22.9% QoQ and -8.6% YoY
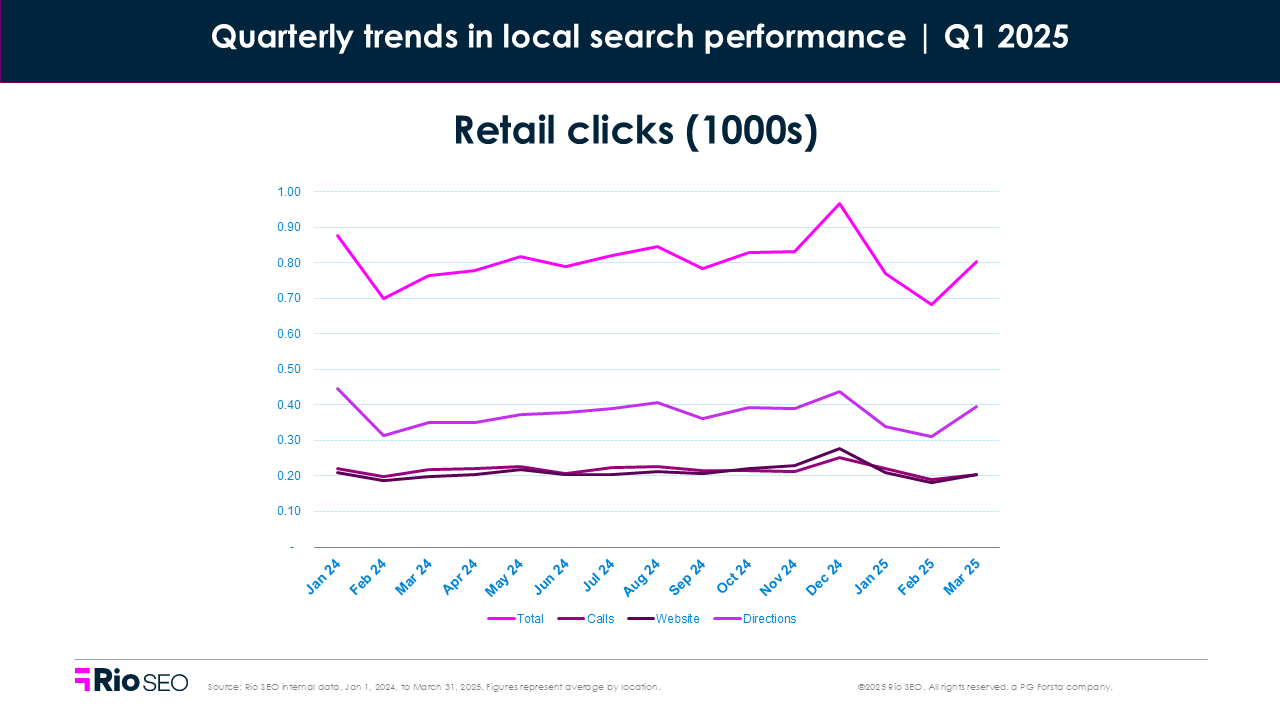
Total Q1 2025 clicks: -14.2% QoQ and -3.7% YoY
Retail brands saw a drop across nearly every metric in Q1 2025.
- Views fell nearly 23% from Q4
- Mobile Maps views were down almost 30%
- Website clicks dropped more than 18%
Seasonality played a role. Q1 often brings a post-holiday pause in shopping urgency. But that’s not the full story. Customers are searching differently. Mobile visibility shrank, while desktop Maps views actually ticked up. That may point to more intentional, research-based behavior; fewer spur-of-the-moment store visits, more careful consideration. It could also reflect changing SERP layouts or how search features present retail listings.
If your listings aren’t complete, up to date, and consistent across channels, you risk getting passed over.
Reputation carries more weight when clicks drop
When fewer customers are clicking through, the information that shows upfront, like your reviews, takes center stage. A few outdated comments or unaddressed low ratings can turn someone away before they ever reach your site or step into your store.
That’s why monitoring and responding to reviews at scale is so critical. And it’s more than just damage control. Brands that engage with reviews, especially negative ones, demonstrate that they value customer experience. Learn how to make it manageable: Managing your online reputation at scale.
Where to focus next
- Prioritize listing accuracy, especially store hours and product availability
- Use Q1 performance as a benchmark for localized campaigns and testing
- Explore how optimized local pages can support search visibility and engagement. See how Price Chopper & Market 32 continues to thrive amid this new fragmented search era
- Build a structured review response process that includes store-level insights
Customers may be clicking less, but they’re expecting more. Make every interaction count, even the ones that never make it to a click.
Financial services
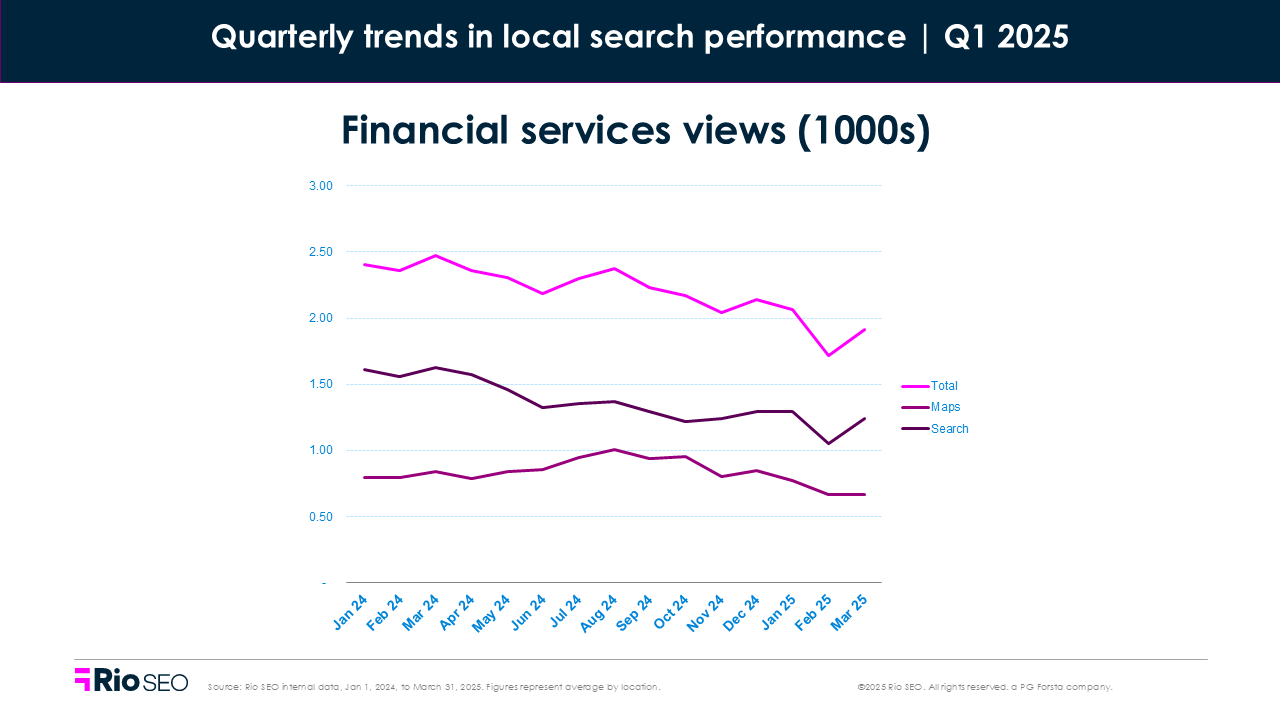
Total Q1 2025 views: -10.3% QoQ and -21.3% YoY
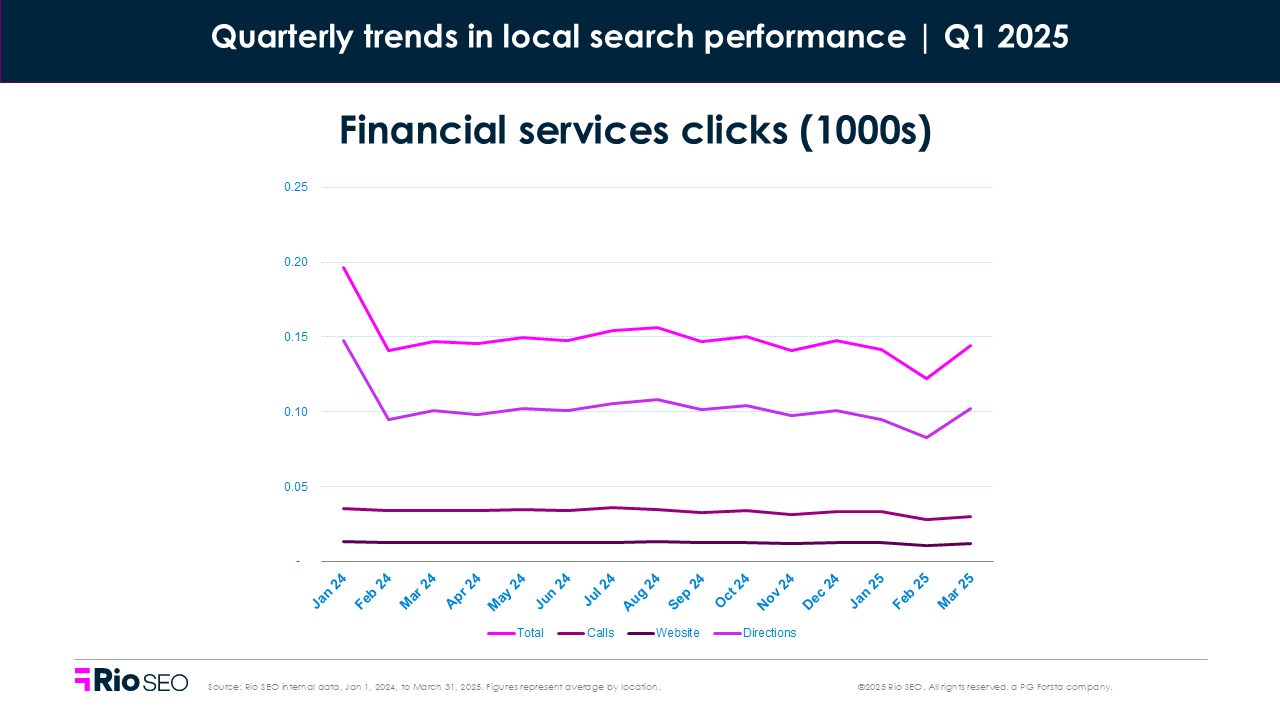
Total Q1 2025 clicks: -6.9% QoQ and -15.7% YoY
Q1 brought a continued slowdown in local engagement for financial brands. Views fell over 10% from Q4, with mobile Maps views down nearly 21%. Clicks followed and were down across phone, website, and direction actions. Compared to last year, the shift is even sharper.
Mobile visibility is falling, but intent may be rising
Desktop Maps views jumped nearly 20% QoQ, even as mobile search dropped off. That shift hints at more deliberate behavior: customers aren’t just searching on the fly. They’re sitting down to research, compare, and decide—especially when it comes to high-consideration services like mortgages, loans, or new accounts.
To stay visible and relevant, financial institutions need more than accurate listings. They need proactive outreach.
With fewer users clicking through on search, the follow-up becomes even more important. Location-level email and SMS campaigns can help bridge the gap, nudging customers with reminders, promotions, or helpful updates tied to nearby branches. It’s a smart way to drive action when search traffic alone slows down. Learn how to localize your email and mobile marketing.
Clicks to call dropped nearly 7%. Direction clicks fell 7.4%. Customers might be looking, but if they hit a wrong phone number or unclear hours, trust erodes fast. In an industry where confidence is everything, accurate local listings aren’t a nice-to-have. They’re the front line of customer experience.
Where to focus next
- Improve listing accuracy for services, hours, and contact details
- Use email and SMS to stay connected between search and action
- See how leading financial brands are adapting to changing consumer behavior; explore real-world strategies here
- Align branch-level messaging with local campaigns to build trust
Local search may be cooling, but smart outreach can keep the conversation going.
Business services
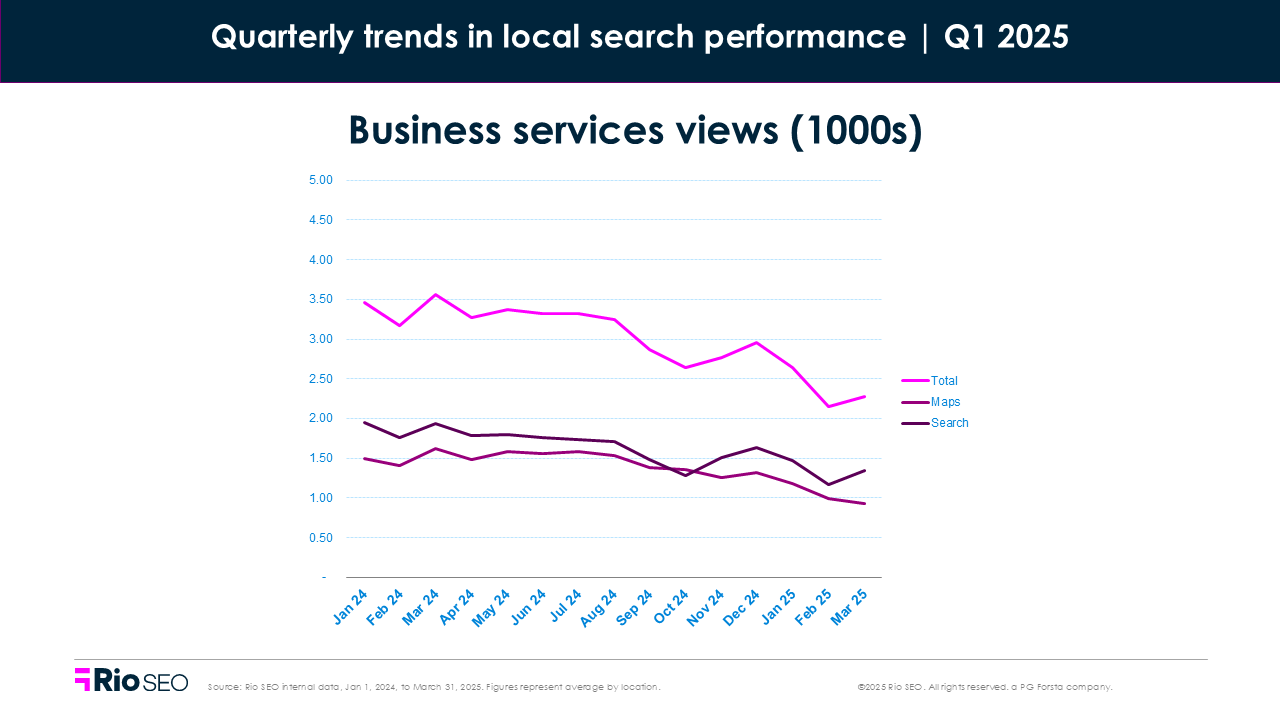
Total Q1 2025 views: -15.3% QoQ and -30.5% YoY
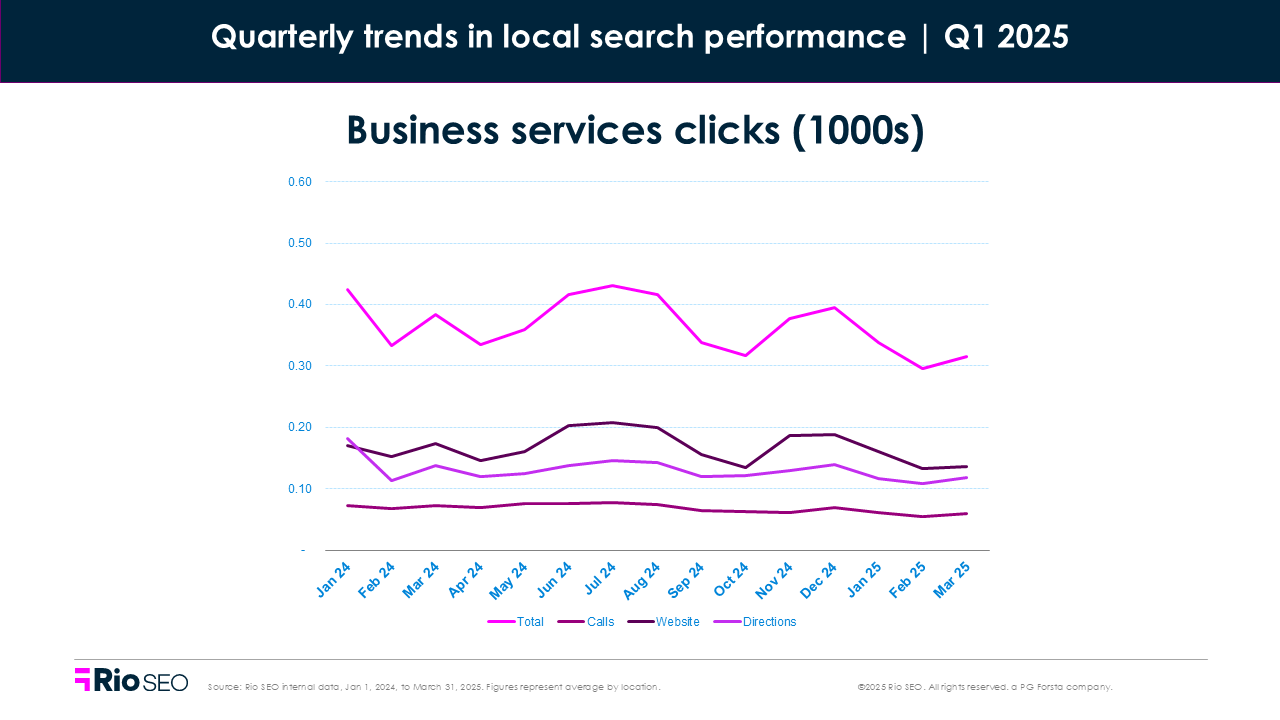
Total Q1 2025 clicks: -13.0% QoQ and -16.8% YoY
Business services saw another quarter of decline in local search performance. views fell sharply, down over 15% from Q4 and more than 30% YoY. Clicks followed suit, dropping across website visits, phone calls, and directions.
Shifts in visibility and behavior
Mobile Maps views dropped 23.4% QoQ, while desktop Maps views actually rose 9.5%. Fewer searches on the go and more from a desktop screen, possibly a reflection of changing habits or how listings are shown in different contexts.
This quarter’s performance was also shaped by a brief algorithm update in January that temporarily inflated some direction clicks and disrupted others. Add ongoing changes like Google’s AI Overviews and SERP layout shifts, and it’s clear that multiple factors are shaping how and where brands show up. Here’s what to watch for.
Less clicking, more skimming?
- Clicks to websites were down 15.4%
- Phone clicks dropped 8.6%
- Direction clicks fell over 12% QoQ
For service-based businesses, where location and availability often drive quick action, that drop matters. But in many cases, searchers may have found what they needed directly in the listing or AI Overviews, no click required.
That’s why accuracy matters. A prospective customer might never visit your site or call. They’ll decide based on what’s in your Google listing: photos, reviews, and hours, etc. If that information is incorrect, you lose the lead without realizing it.
What to focus on next
- Audit and update local listings regularly, especially hours and services
- Use Q1 data to spot where engagement dropped and investigate why
- Prioritize review response and ratings to boost local visibility; see how a national staffing firm did it
- Keep campaign timing aligned with seasonal shifts in demand
Even when search volume dips, customer expectations don’t. Make every listing count.
Healthcare
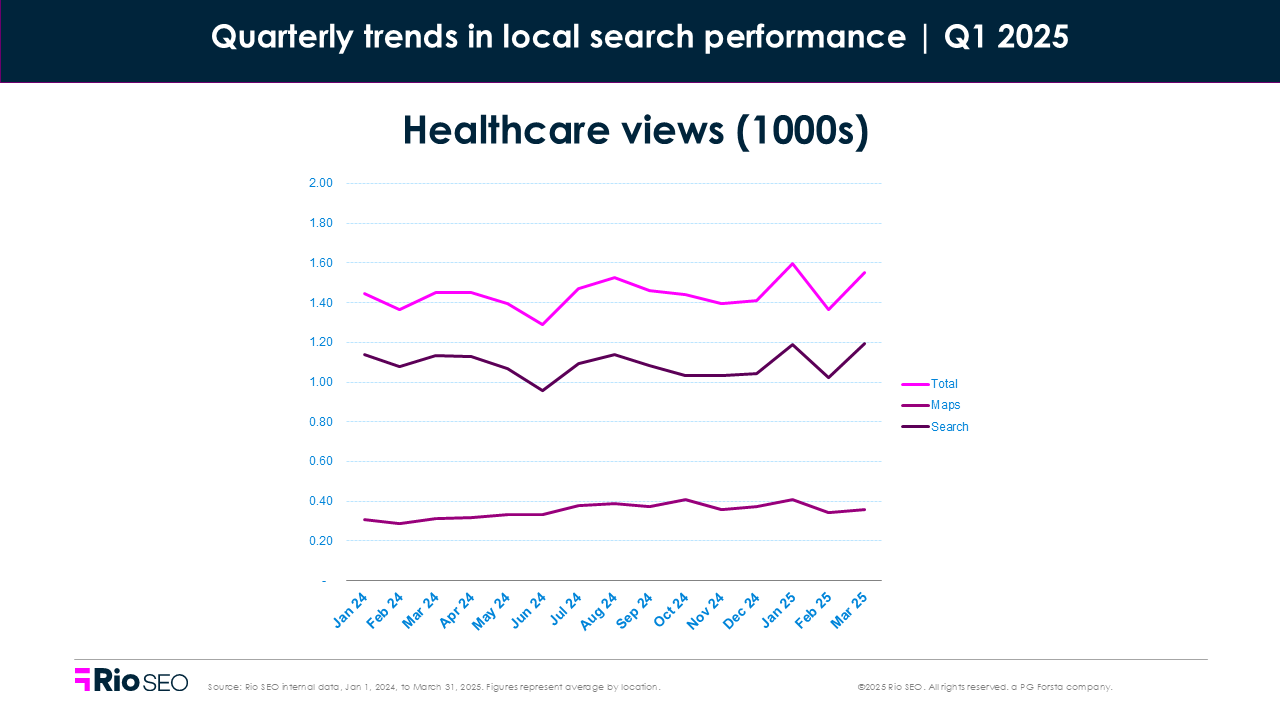
Total Q1 2025 views: +8.0% QoQ and +24.0% YoY
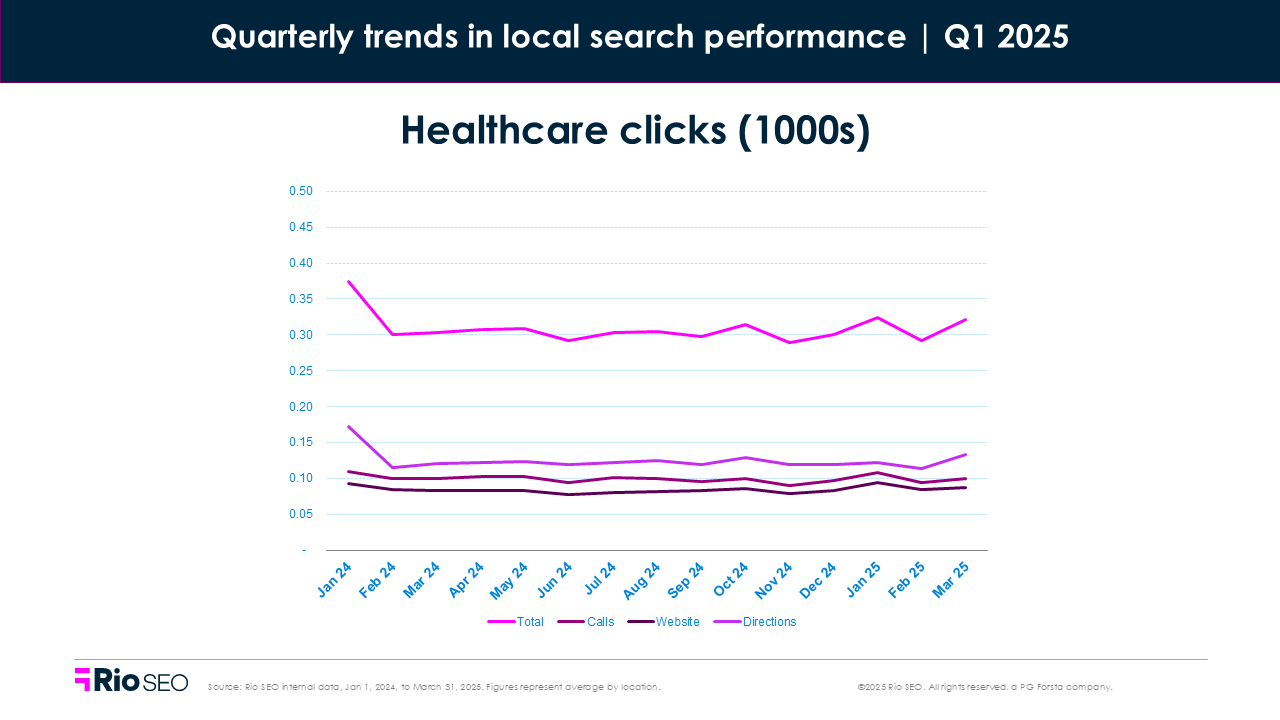
Total Q1 2025 clicks: 0% QoQ and +24.0% YoY
Q1 brought a bump in visibility for healthcare providers amid the height of cold and flu season. views rose 6.3% from Q4, with steady year-over-year gains. Mobile search behavior showed mixed signals, as Maps > Mobile views dipped slightly, but website clicks rose 7.4%, and phone clicks climbed 5.1%.
More searches, but mixed signals
Search visibility is increasing, but that doesn’t always translate to patients converting. Direction clicks were flat (+0.2%), and total clicks remain slightly below last year’s levels. It’s a reminder: patients may be browsing more, but not all interactions lead to action. Some may be comparing clinics and providers, or searching for insurance accepted and appointment availability. Others may get what they need from the listing, without ever clicking.
Clicks to call rose 5.1%, a good sign for appointment-driven providers. But if calls aren’t answered quickly, or if the listing leads patients to the wrong department, you lose trust fast. Healthcare decisions are high-stakes. Every detail in your listing helps patients feel more confident in their next step.
Get found everywhere patients look
While Google dominates local search, Apple Maps is quietly growing its influence, especially on iPhones and in-car navigation. To make the most of rising visibility, ensure your locations are optimized beyond Google. That means complete, consistent listings across every platform your patients use to find care.
See our guide to leveraging Apple Business Connect to ensure your healthcare network is showing up where it matters.
Where to focus next
- Audit listings across platforms (including Apple) for accuracy and coverage
- Route phone numbers directly to schedulers or relevant departments
- Pair high-interest locations with localized content to boost visibility; see how a national pharmacy brand did it
- Use growing views as a signal to support campaigns with paid local ads
More searches mean more chances to connect, but only if patients can find you, trust you, and act with confidence.
Hospitality
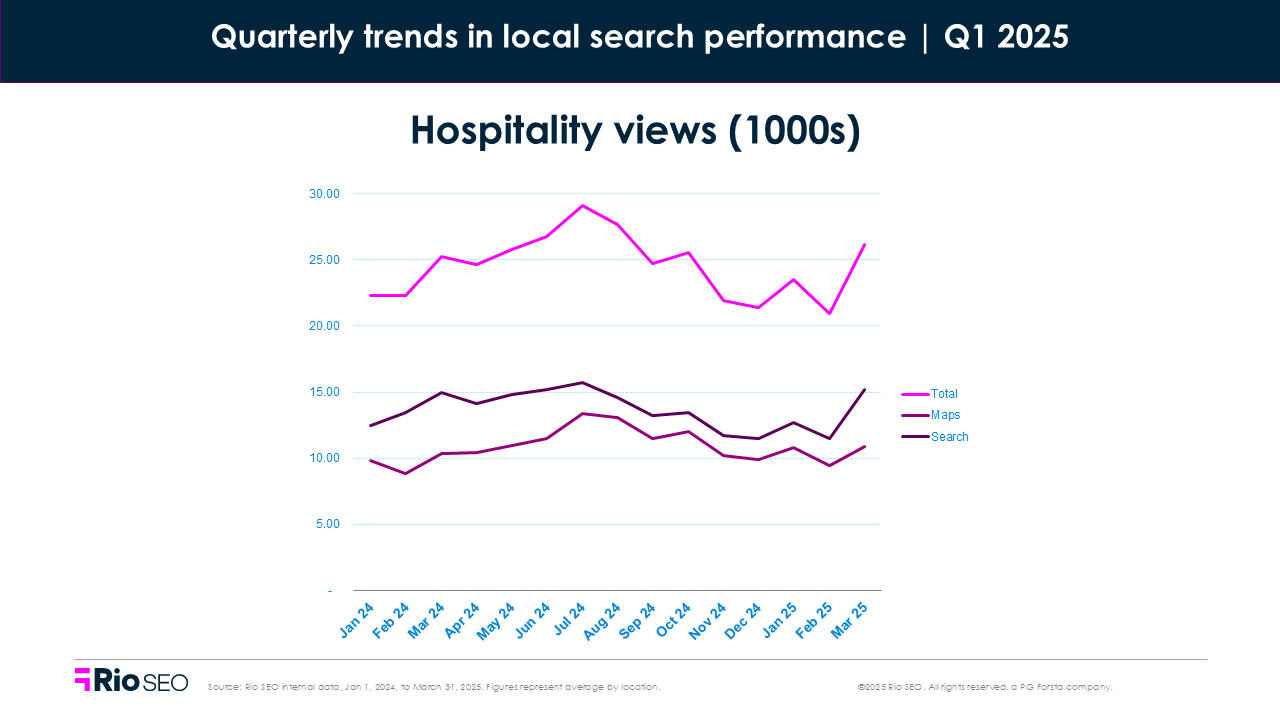
Total Q1 2025 views: +2.5% QoQ and +1.0% YoY
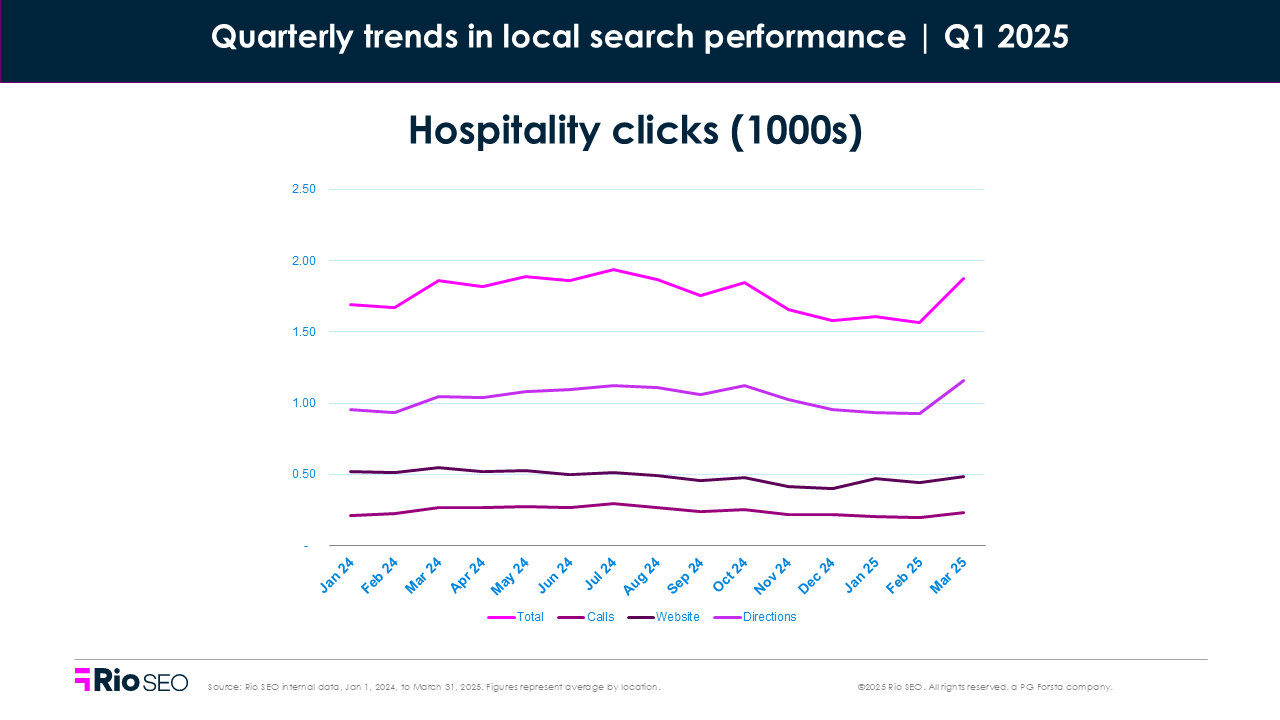
Total Q1 2025 clicks: -0.8% QoQ and -3.2% YoY
Hospitality brands saw a modest lift in visibility this quarter, but it didn’t translate into more action, aligning with historical travel patterns, with peak travel season beginning late spring. While views rose slightly, clicks to call and get directions continued to slide, and website visits stayed mixed.
Searchers are browsing, but not always booking
- Mobile views on Maps dipped 3%
- ebsite clicks climbed nearly 8%
- Direction clicks fell 2.9%
What does this suggest? Guests may be planning by scouting locations, and comparing amenities, but they’re holding off on final decisions.
That behavior is especially common in hospitality, where the choice often hinges on specific experiences. Generic listings can’t carry all the weight because guests don’t just search for a brand; they search for features. “Golf resorts near me.” “Spa day packages in Scottsdale.” If you’re not surfacing individual experiences, you’re likely missing out.
That’s where local specialty pages shine. Dedicated pages for high-interest amenities (like spas, golf courses, or restaurants) boost discoverability and drive more direct traffic. See how to make yours work harder in our Local Pages Playbook.
Clicks to call also dipped 7.4% this quarter, but bookings often start with questions. When guests do call, they’re often looking to confirm availability or ask about upgrades. If that call doesn’t go through, or lands in the wrong department, you’ve lost a potential guest before they’ve even packed their bag.
Where to focus next:
- Build dedicated local pages that highlight unique amenities like spas, restaurants, or event spaces
- Refresh listings regularly with seasonal offerings, special packages, and accurate hours
- Monitor click and direction trends to spot where interest drops off—and why
- Identify top-performing locations and replicate their tactics across underperforming sites
Hospitality is all about the experience. Ensure your local presence accurately reflects the full story, as a better guest journey begins long before they check in.
Restaurants
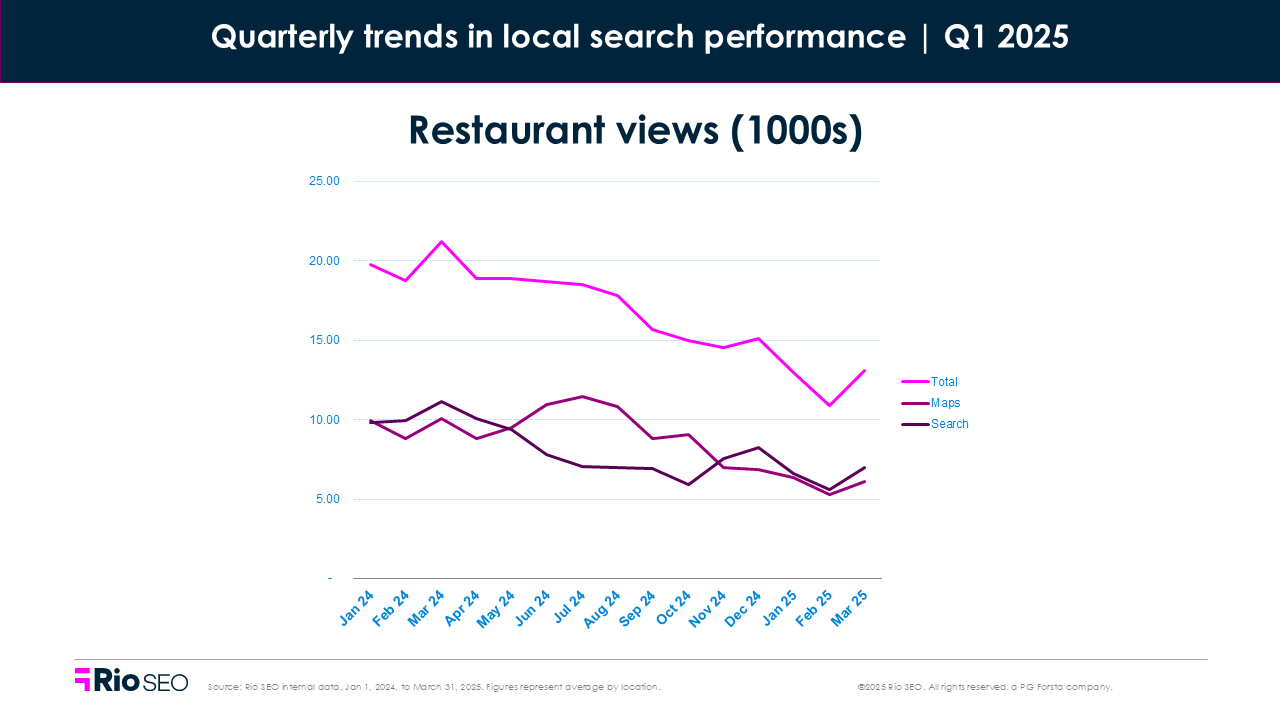
- Total Q1 2025 views: -17.2% QoQ and -38.2% YoY
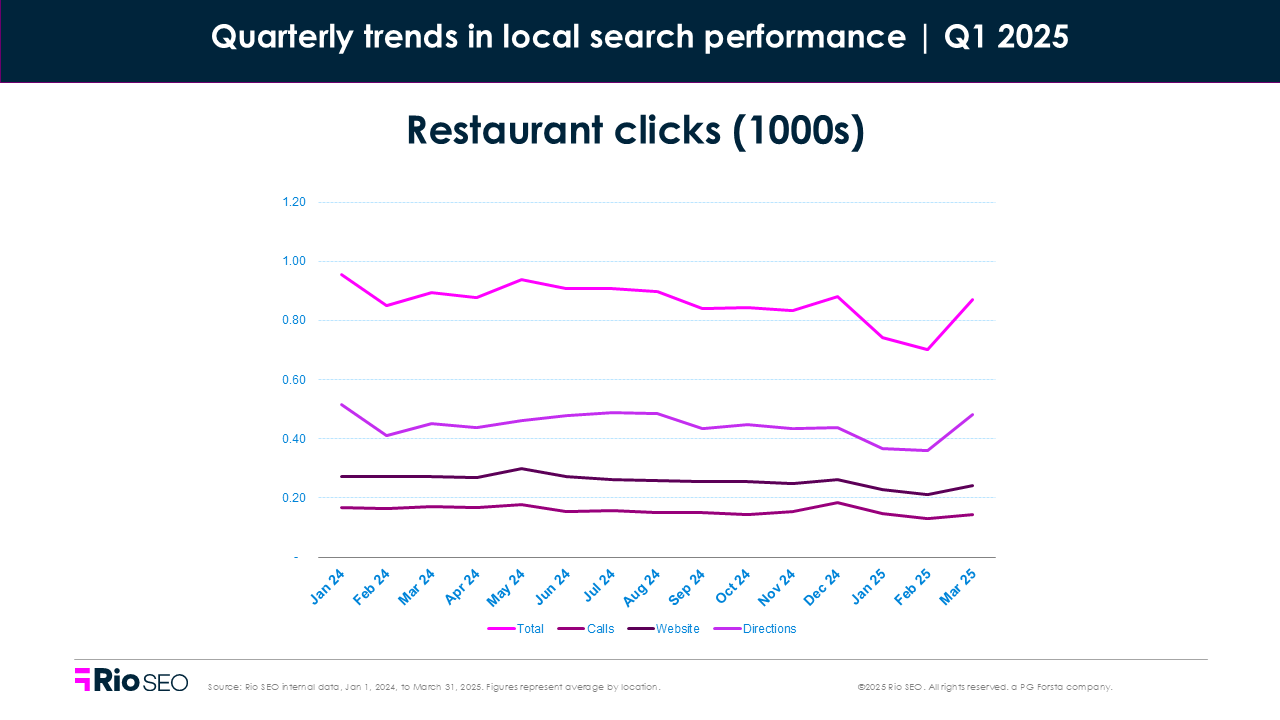
- Total Q1 2025 clicks: -9.6% QoQ and -14.3% YoY
- Q1 2025 food menu clicks: -5.7% QoQ and -33.3% YoY
- Q1 2025 food order clicks: +0.9% QoQ and -40.4% YoY
When it comes to restaurants, local search performance took a hit this quarter. views dropped sharply, especially on mobile, and clicks followed. Even high-intent actions like viewing menus and placing food orders declined significantly year over year. But brighter days are likely ahead. Warmer months means renewed interest in patio brunches and dining out in general.
Fewer views don’t mean demand has disappeared, though. Diners may simply be skipping the scroll and heading straight to the source — or bouncing when listings don’t surface the info they need fast.
Don’t bury the basics
Is the menu link visible? Are your hours clear? Can someone order takeout in a tap? When local listings miss these essentials, potential guests move on, especially when they’re hungry.
To drive more traffic from local search, start with consistent, complete listings. That means accurate hours, clickable menus, updated URLs, and category tags that reflect your real offerings — delivery, dine-in, curbside, and more. Small details make a big difference. Get more tips in The definitive guide to online listings for restaurant brands.
Where to focus next:
- Add direct links for ordering and menu views
- Ensure listings reflect accurate hours and fulfillment options
- Track performance across channels to catch behavior shifts early
- Create local landing pages tied to promotions or limited-time offers; see how one fast-casual brand used hyperlocal content to drive measurable gains
Even when clicks cool off, every local impression is a chance to serve up what diners are looking for.
Multi-family residential
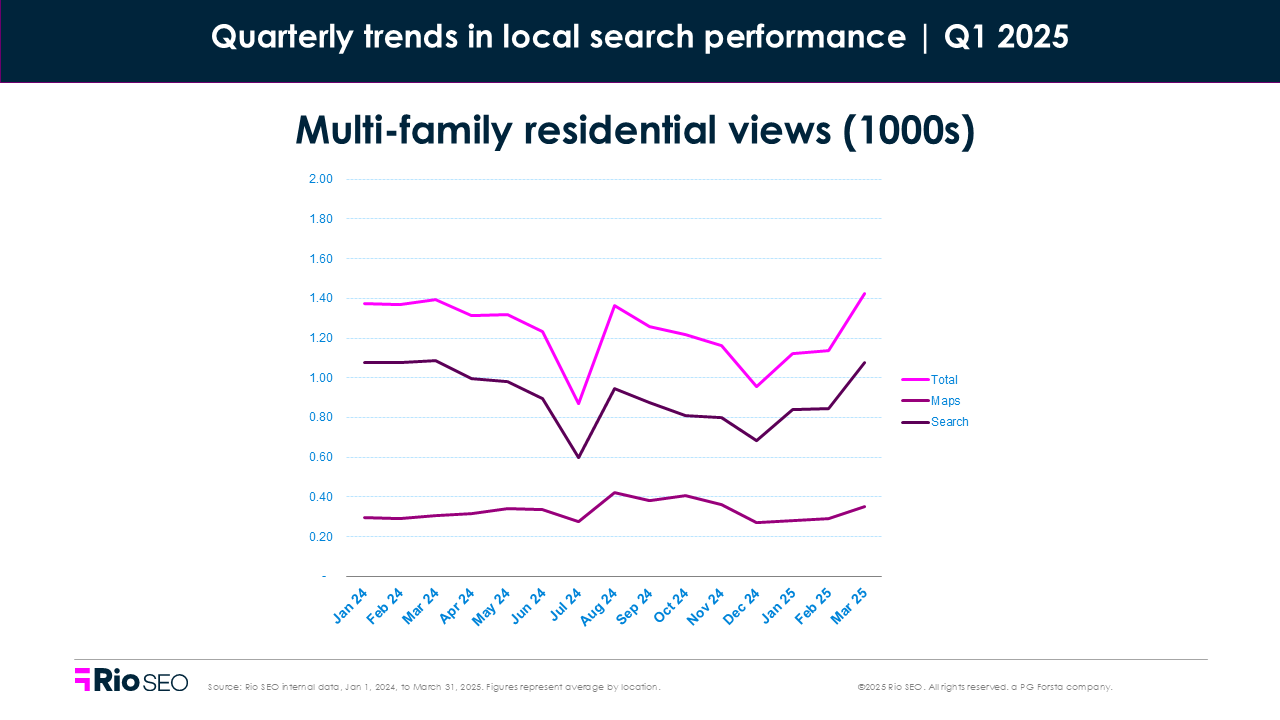
Total Q1 2025 views: +10.2% QoQ and -11.2% YoY
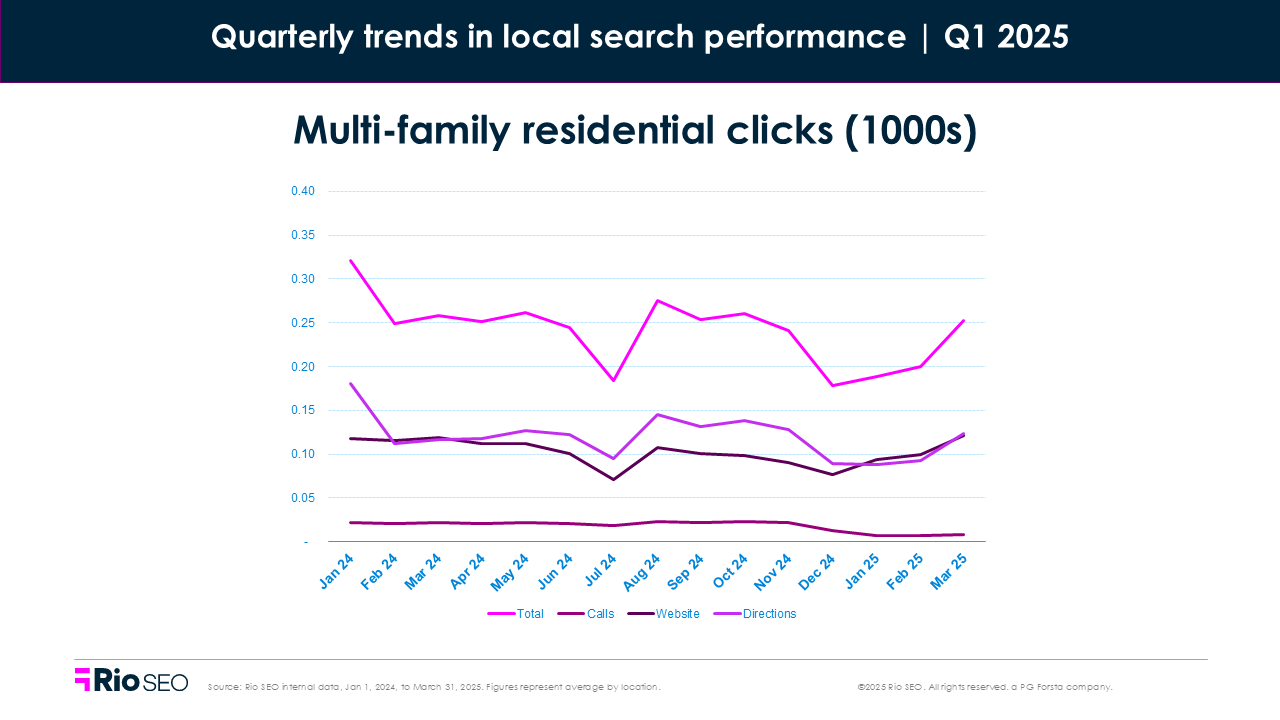
Total Q1 2025 clicks: -6.0% QoQ and -23.0% YoY
Visibility is up, but action is down. Local views rose 10.2% this quarter, yet total clicks dropped—especially phone calls, which plummeted 60% from Q4. Website clicks and direction requests also declined, even as more eyes landed on listings.
So, what’s going on?
Prospective renters may be narrowing their options faster or skipping calls and visits in favor of researching online. And not every interaction shows up as a click. If your listings give them what they need (photos, amenities, tour scheduling links), they might decide without ever engaging.
Measure what matters most
It’s easy to chase vanity metrics like raw views. But views without interaction don’t lease apartments. Focus on metrics that reflect real renter interest; metrics like website clicks, tour sign-ups, and actions that happen off-Google. Here’s how to rethink your local performance strategy.
Engagement is shifting, not disappearing. Clicks to website rose 18.2% QoQ, and direction clicks only dipped slightly. Meanwhile, desktop search views jumped nearly 24%. That suggests potential renters are still searching, but they may be doing it from home, weighing options more seriously before visiting in person.
Where to focus next:
- Track listing performance and post-click behavior to understand renter intent
- Highlight key selling points like floor plans and amenities with high-quality local photos that match the neighborhood vibe
- Connect listings to conversion paths like booking engines or inquiry forms
- Use direction and website click data to identify high-interest locations and inform leasing strategies
More visibility is a good start, but making the most of it means measuring what moves the needle.
Local visibility is shifting—are you keeping up?
Local isn’t slowing—it’s evolving. Brands that adapt faster will win the next customer before they ever click.
Q1 showed us that search behaviors are changing fast. Some industries surged ahead while others slipped, but across the board, one truth stood out: customer intent is still alive and well. You just have to know where to look.
Get proactive. Audit your listings, dig into performance beyond views, and tune into what really drives clicks, visits, and conversions. Whether it’s a single location or hundreds, local search is your frontline. Make sure it’s working as hard as you are.
Want to know where you stand? Request your free local audit to uncover hidden gaps, growth opportunities, and tips tailored to your brand.
Related resources

Leading mobility company turns reputation management into a powerful acquisition and revenue driver

evo: Turning reputation into a growth engine

Solotel: Using guest feedback to drive visibility, engagement, and better decisions
Newsletter
Get industry insights that matter, delivered direct to your inbox
We collect this information to send you free content, offers, and product updates. Visit our recently updated privacy policy for details on how we protect and manage your submitted data.