Local Consumer Search Behavior Trends in Q4 2023

Google Business Profile (GBP) performance metrics shed light on the diverse customer experiences happening across your brand’s various locations. Rio SEO enables you to explore these insights at the location, regional, and brand level – but what do these metrics mean in the broader context of your industry as a whole?
With each passing quarter, we unveil a treasure trove of trends and invaluable insights, meticulously distilled from our extensive analysis of over 205,000 enterprise business locations, spanning eight distinct business sectors. The customer experience (CX) trends derived from our GBP performance research will not only lend depth to your brand’s metrics but also pave the way for innovative strategies in local marketing.
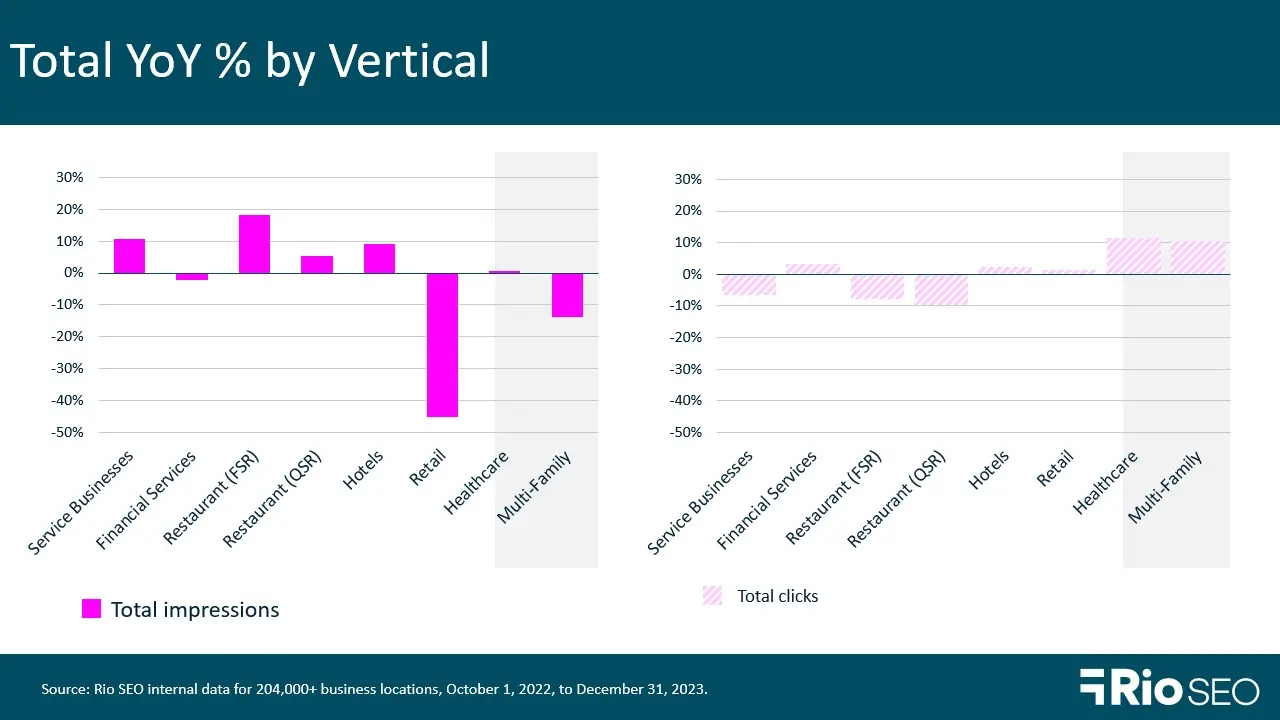
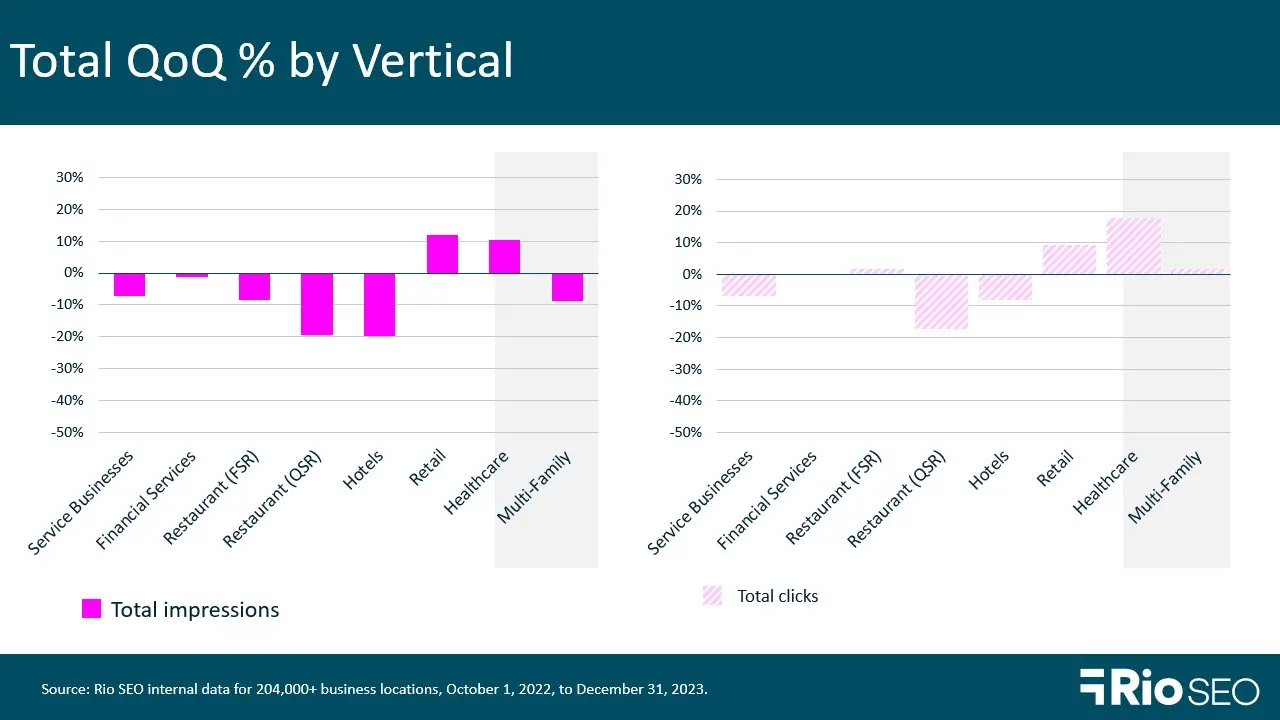
In Q4 2023, we saw near-universal declines in average total impressions, with only retail and healthcare escaping the trend. How that translated to boots on the ground – or clicks for directions, phone calls, or web visits – varied widely by industry segment.
Dig into more industry-specific insights below, and we’ll share expert advice along the way to elevate your local marketing game.
Business services
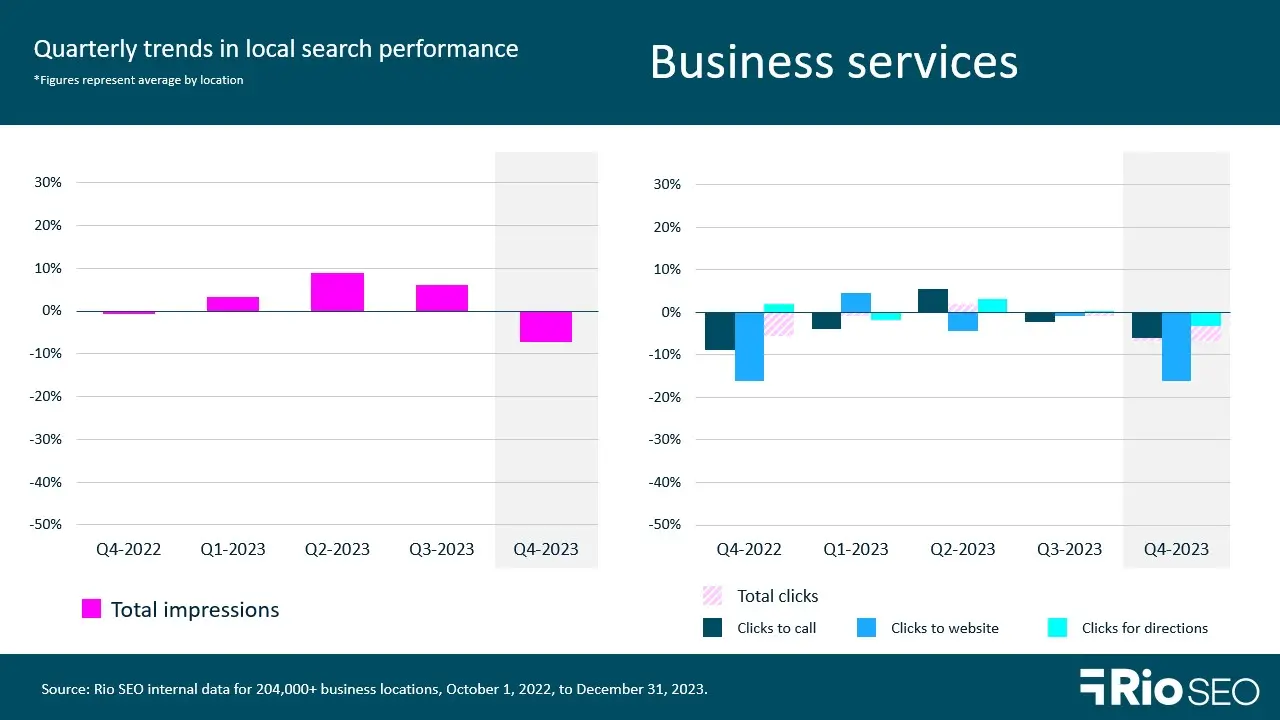
- Total Q4 2023 impressions -7.3% QoQ and +10.7% YoY.
- Total Q4 2023 clicks -6.7% QoQ and -6.5% YoY.
Total impressions for business services brands such as gyms, salons, post offices, and IT facilities in Q4 fell by over 7%, losing the 6.1% gain made in Q3 and then some. However, this still represents a 10.7% improvement over the fourth quarter of 2022.
Total clicks were down close to 7%, as well, and fell 6.5% from Q4 2022. This is largely due to a 17.1% YoY drop in clicks to website; clicks to call and clicks for directions fell to a lesser extent at 6.8% and 1.7%, respectively.
Make your customer’s transition from search to an on-site visit a seamless one by ensuring all essential NAP (name, address, phone number) data is correct on each of your Google Business locations. Our local listings management solution is built for multi-location brands, and makes quick work of managing your NAP info, CTAs, hours, and more to Google Business and hundreds of other popular listing sites. Never let a customer down with the wrong location information again.
Financial services
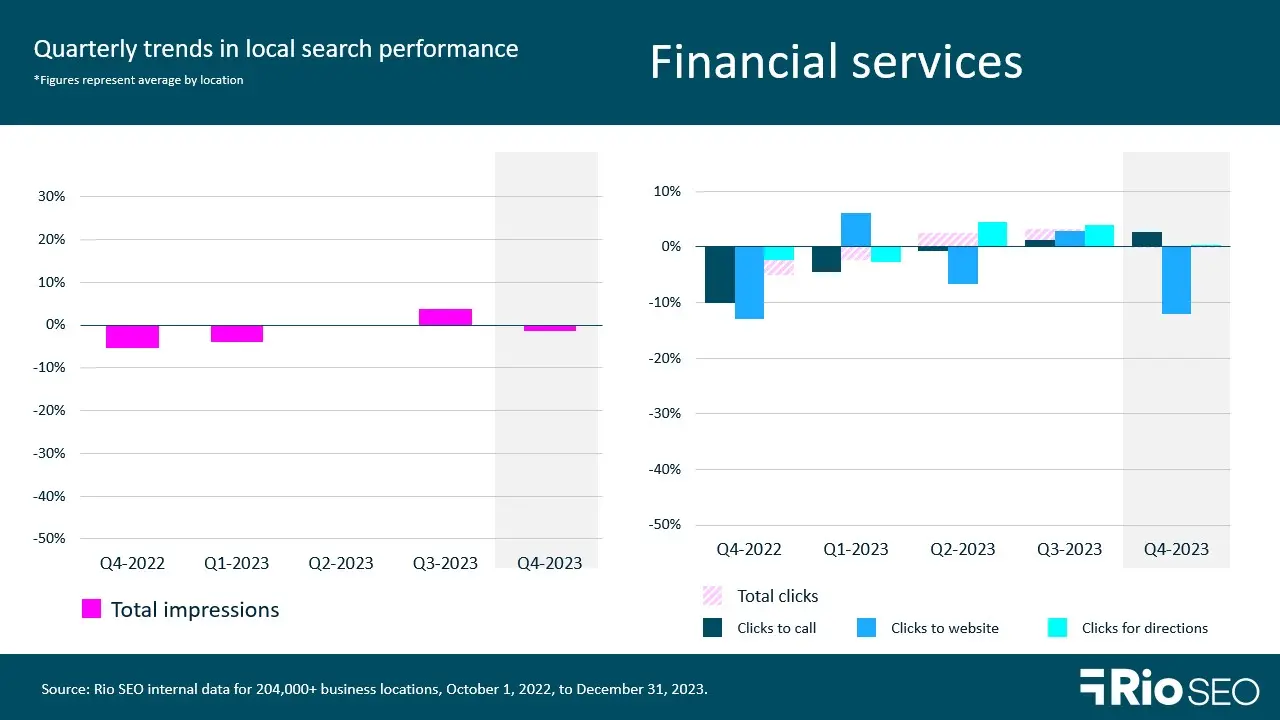
- Total Q4 2023 impressions: -1.4 QoQ and -7.1% YoY
- Total Q4 2023 clicks: -.06% QoQ and +3.2% YoY
Financial services brands include banks, investment companies, insurance agencies, and other financial institutions for the purposes of this research. Brands in this segment saw Q4 GBP impressions fall slightly by 1.4% from Q3, marking a 7.1% decline YoY. Conversion actions fell less than 1% after gaining 3.3% last quarter and were up 3.2% over the same period last year.
Trust and brand reputation are essential in financial services, where inaccurate data can lead to not only a poor customer experience but a real liability for the business, as well. Consistent citations and proactive local review management are two key elements of a successful brand reputation strategy.
When customers have wildly varying experiences with different branches and offices, even top performers are negatively impacted by the erosion of consumers’ trust in your brand. Worse, if search engines like Google lose trust in your brand, it can be difficult for your locations to get found in those competitive local search results at all.
This is illustrated in the experience of a Southern US bank with dozens of locations across four states. Implementing local listings management to bring their citation accuracy near 100% on Google and Bing, combined with Rio SEO’s Local Reviews solution, drove a 425% increase in total views in Google local search, an 87% jump in phone calls, and 27.5% more loan applications. Learn more about their winning strategy here.
Full-service restaurants
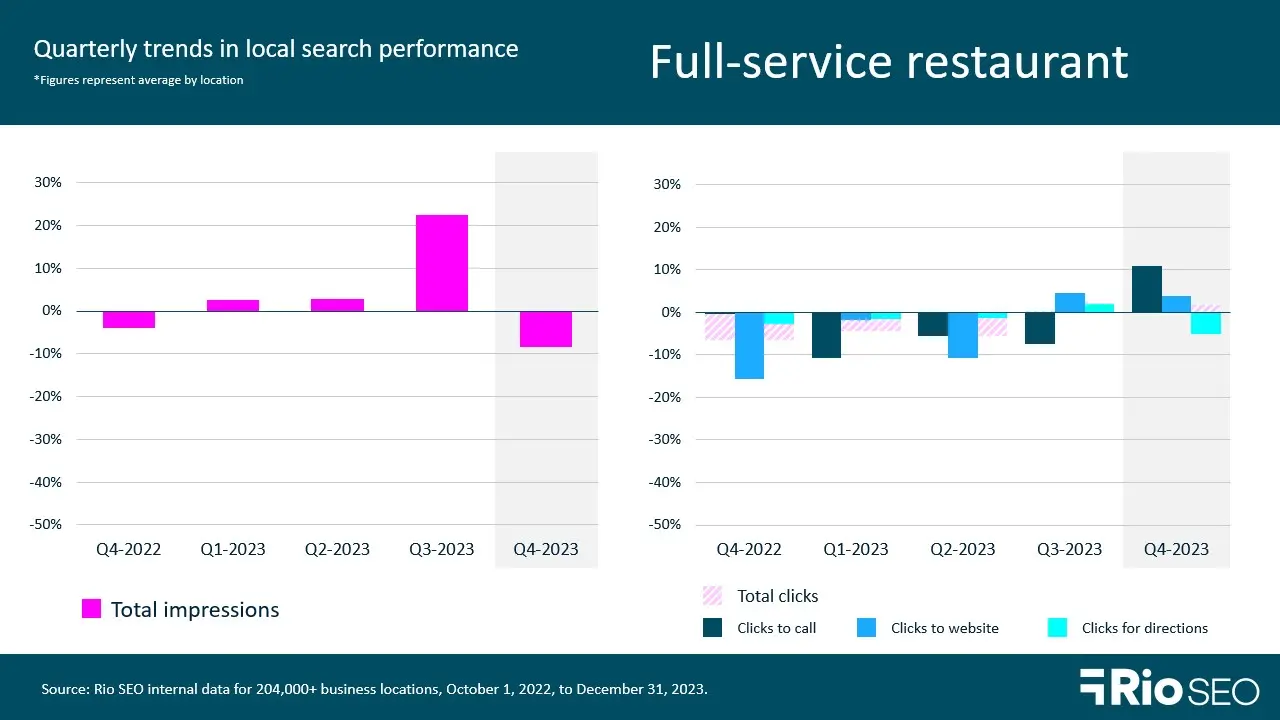
- Total Q4 2023 impressions: -8.5% QoQ and +18.3% YoY
- Total Q4 2023 clicks: +1.7% QoQ and -7.8% YoY
- Q4 2023 food menu clicks -25.3% QoQ and -11.8% YoY
- Q4 2023 bookings: +2.5% QoQ and -35.7% YoY
- Q4 2023 food order clicks: -20.8% QoQ and -46.5% YoY
Restaurants have several GBP performance metrics to consider since Google added Food Menu, Bookings, and Food order clicks to restaurant reporting. In the full-service sector during Q4, we saw substantially more (18.3%) impressions year-over-year, but all types of clicks were down.Food menu clicks fell the furthest on a quarterly basis, by 25.3%.
December was a strong month for the restaurant industry in terms of sales and foot traffic, but full-service establishments were not the beneficiaries of that growth. Guest XM reports that although same-store sales grew 2.3% YoY in December (up from 1.9% in November and 1.4% in October), all full-service segments experienced negative traffic growth during December. Average guest check growth slowed to 3.4% in December, compared to an average of 6% YoY during the first three quarters of 2023.
GBP attributes remain one of the best ways to help your locations stand out in competitive local search listings, and Google offers a variety of them specific to restaurants. Using these attributes can help your restaurants appear in specific searches where customers are looking for a certain type of food, accessibility features, or pickup and delivery options, for example.
Download a free copy of ‘The definitive guide to online listings for restaurant brands’ to learn more.
Quick-service restaurants
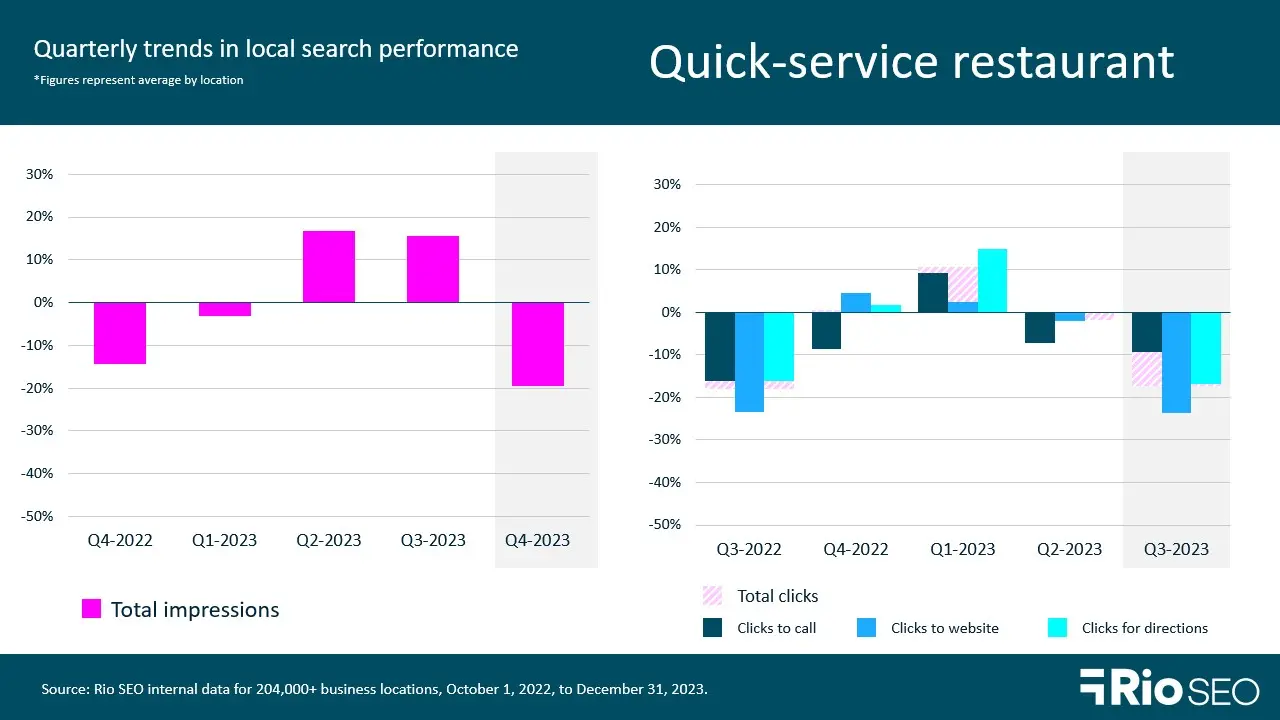
- Total Q4 2023 impressions: -19.5 QoQ and +5.3% YoY
- Total Q4 2023 clicks: -17.3% QoQ and -9.6% YoY
- Q4 2023 food orders: -60.4% QoQ and +200% YoY
- Q4 2023 food menu clicks: -41.2% QoQ and -22.3% YoY
Total clicks continued their quarterly slide, falling 9.6% in Q4 following a 10.6% decline in Q3. Impressions fell almost 20% in the final quarter, although this still resulted in them being 5.3% higher than in Q4 2022. While food orders fell QoQ, it seems customers are using this feature more often as we see they were up 200% over the year prior.
Despite this slump in online activity, GuestXM reports that Q4 sales growth was strong for quick service restaurants. “During December, the two segments with the best same-store traffic results were fast casual and quick service,” they reported recently. “While all full-service segments experienced negative traffic growth during December, fast casual achieved strong positive growth.”
The ability to monitor and respond to reviews during these periods of increased foot traffic is critical. Reviews not only feed the needs of prospective diners looking for real-world experiences but also support local search rankings and provide your brand a wealth of customer experience data you can use to drive new business. Make sure you have an ironclad process in place for review response so you don’t miss out on a single opportunity to engage those who are talking about your brand.
Hotels
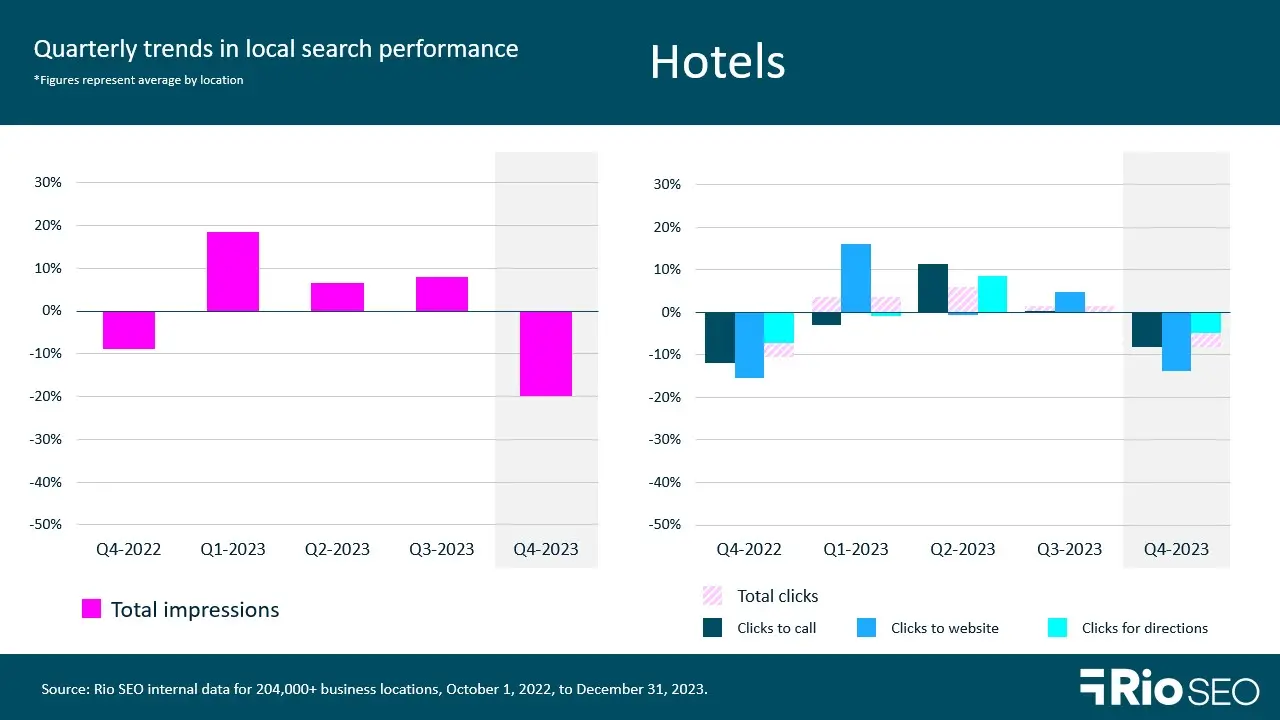
- Total Q4 2023 impressions: -19.8% QoQ and +9.1% YoY
- Total Q4 2023 clicks: -8.1% QoQ and +2.4% YoY
- Q4 2023 bookings: +16.3% QoQ and +182.7% YoY
Hotels lost their Q2 & Q3 gains in impressions with a dramatic 19.8% drop in Q4. However, we can attribute this to seasonal trends and overall the growth picture is still good as impressions are still up over 9% from Q4 2022.
Hospitality brands should pay particular attention to the rise in popularity of bookings via local search, which gew 16.3% quarterly and is up 182.7% from last year. Clearly, this is a GBP feature customers appreciate and are increasingly using to book their stays.
There are a few particularly important local search optimizations for hotel brands to focus on as we kick off 2024:
- Listings accuracy, making sure all locations are claimed, verified, and kept up to date.
- Specialty pages for your hotel spas, salons, restaurants, golf courses, etc., with properly implemented schema markup.
- Review management, to keep a steady stream of interactions happening between your brand and hotel guests.
You’ll find more helpful tips including a Google Business Profile optimization checklist for hotel brands in this free guide.
Retail
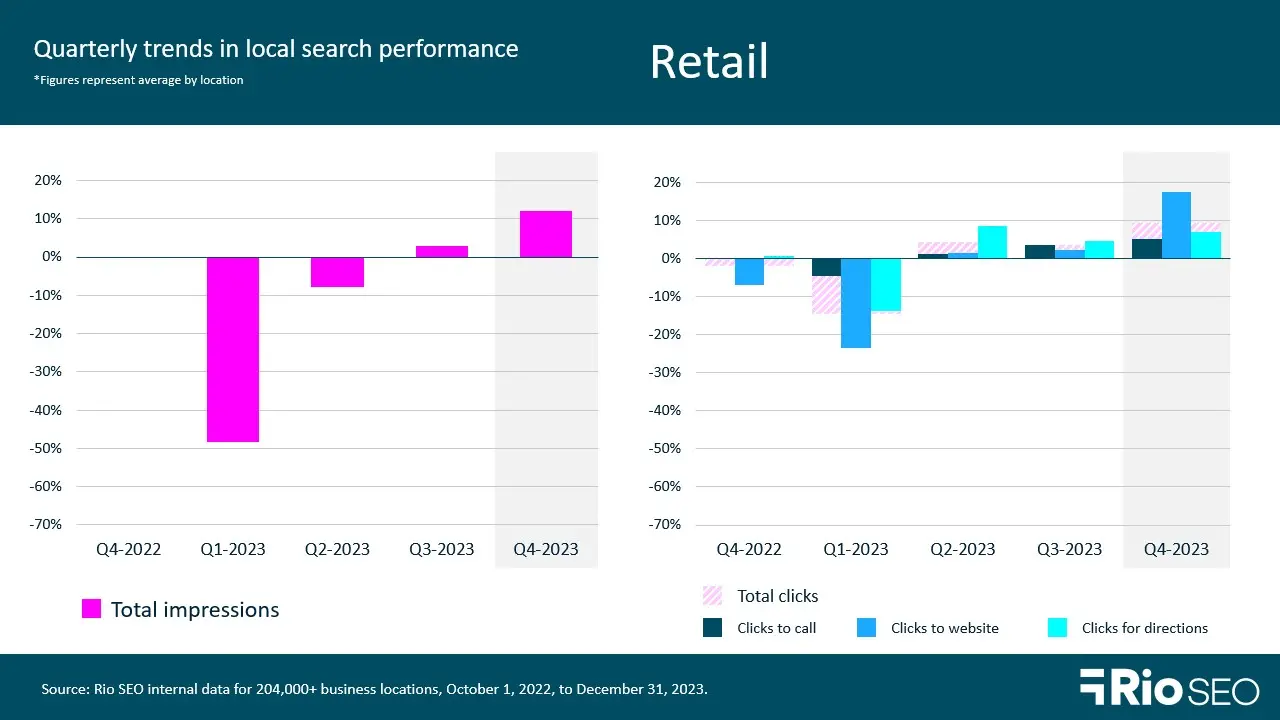
- Total Q4 2023 impressions: +12% QoQ and -45.3% YoY
- Total Q4 2023 clicks: +9.3% QoQ and +1.4% YoY
Brands in the retail segment are facing a lot of challenges given economic uncertainty and the pace of inflation. Impressions rose 12% in Q4 and although the 45% drop compared to Q4 2022 may seem alarming, we must remember the context of COVID. Ongoing pandemic concerns leading into the 2022 holiday shopping season had shoppers checking more often to make sure stores were open, with many choosing to stay home and order online versus shopping in-store.
Taking a look at conversion actions gives us a better idea of how those impressions translated to action at the local level. This holiday season brought a 9.3% quarterly increase in total and clicks and 1.4% growth over the last year of 2022.
Colliers reports that core retail sales (excluding gasoline, food service, and auto vehicle purchases) increased by 3.3% at the end of 2023. “The holiday period saw consumers actively engaging in retail experiences, driven by a desire for enjoyment. This prompted some to temporarily ease financial constraints, leading to a notable uptick in credit utilization for purchases,” they noted.
The report also found that “Buy Now Pay Later” adoption increased this past holiday season, with usage up 17% from last year.
Retail brands can further sweeten the pot for consumers who may be feeling the economic pinch by making coupons, discounts, and other incentives available on local pages and via Google Posts. Download our guide on personalizing the retail customer’s experience – from search to sale to learn about these tactics and more.
Healthcare
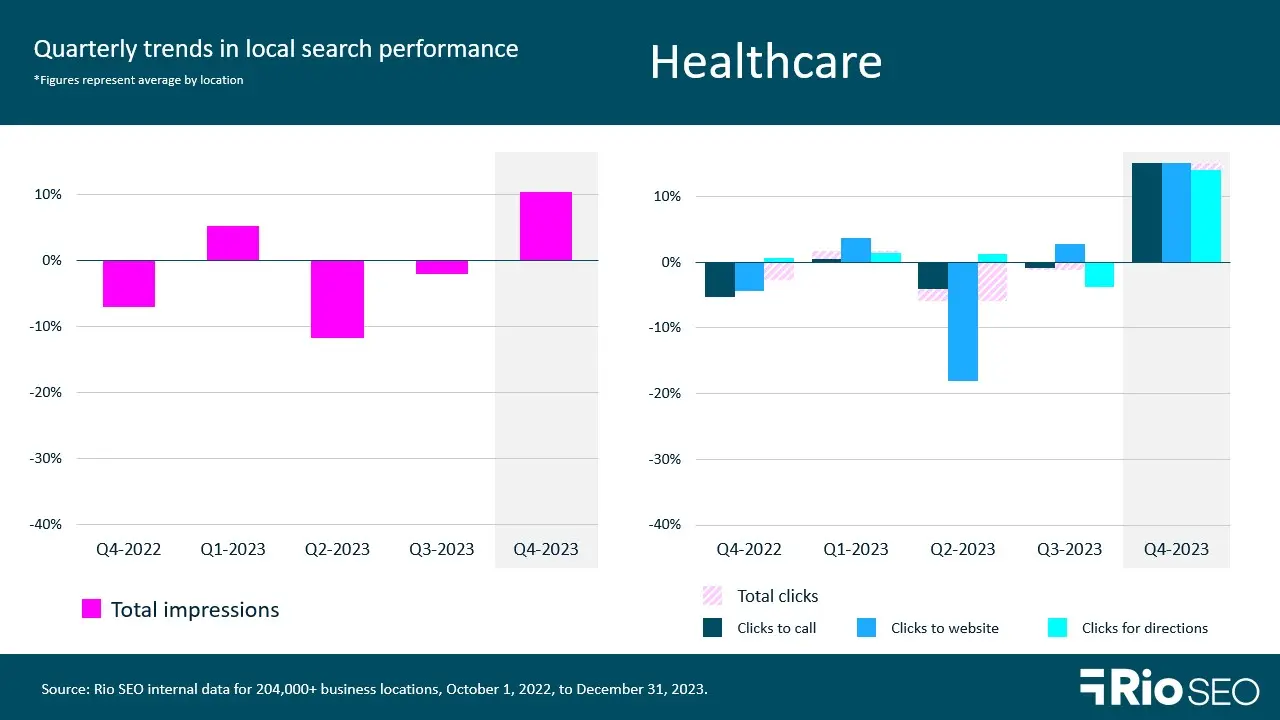
- Total Q4 2023 impressions: +10.3% QoQ and +0.5%
- Total Q4 2023 clicks: +17.9% QoQ and +11.4% YoY
Q4 brought better news for local healthcare brands in the reversal of the previous two quarters’ downward trend. Total impressions grew 10.3% for the quarter, while total clicks rose 17.9%.
Trust is essential is all industries, but even more so in healthcare. Searchers are heading to Google, Apple, and other online sources to find hospitals that take their insurance, clinics that are open when they need to be seen, specialists in specific types of medicine, and more. Meeting healthcare consumers in search with accurate and up to date listings is key, but that’s only the beginning of the interaction.
What kind of experience are customers having with your brand across the local search ecosystem? Social listening is a great way to capture real-time feedback. Using machine learning and AI can help you uncover trends and deep insights in customer data from local reviews, post-visit surveys, chat logs, emails and more, as well.
Learn more about measuring your local customer’s experience and CX metrics you need to know in this article.
Multi-family residential
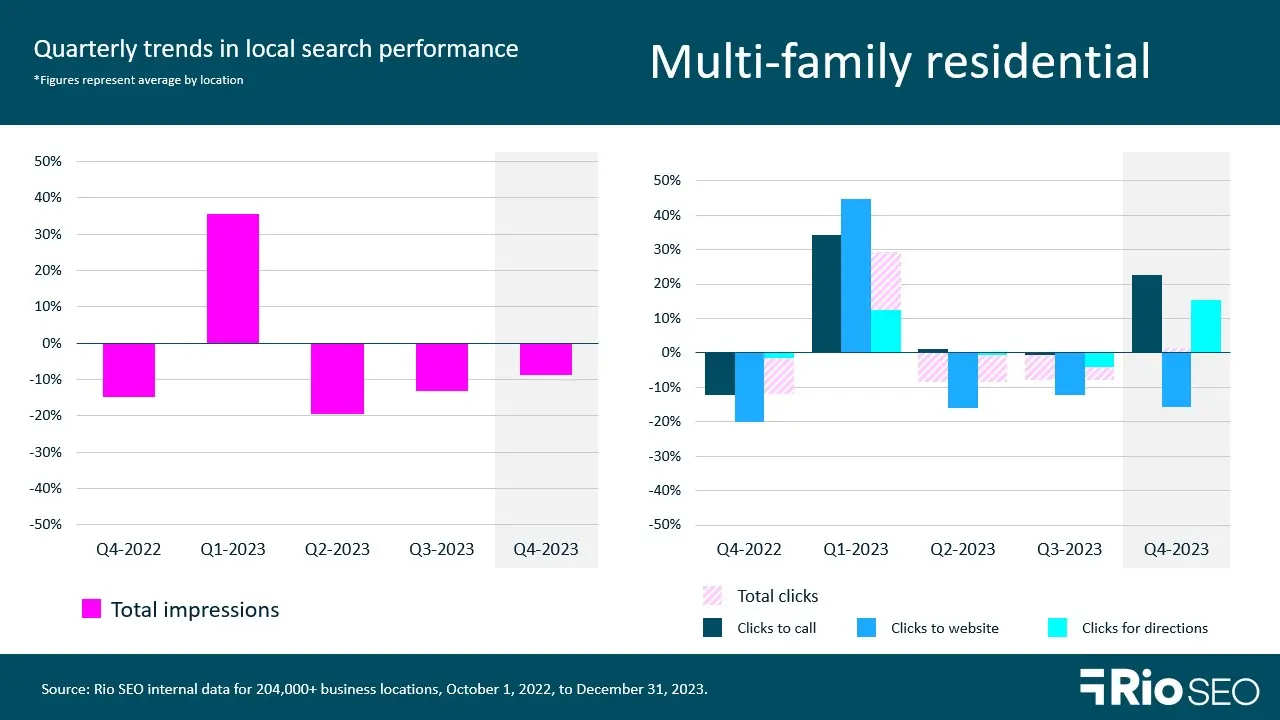
- Total Q4 2023 impressions: -8.8% QoQ and -13.7% YoY
- Total Q4 2023 clicks: +1.6% QoQ and +10.7% YoY
Despite a drop in total impressions, multifamily residential brands saw a 1.6% quarterly increase in total clicks. The 8.8% downward slide for impressions is an ongoing trend, as we saw declines of 13.2% and 19.5% and Q3 and Q2, respectively.
Here, again, we can likely attribute some of this decreased search activity to the pandemic. Throughout 2022, Omicron variants wreaked havoc with business activity, and consumers; informational needs spiked in Q1 2023.
What matters most in Q4 2023 performance data are the average increases in clicks to call and clicks for directions that brands in this space experienced. If that is not reflected in your enterprise GBP reporting, it’s worth an exploration into potential reasons. Google is looking to provide searchers the best possible answer to their every need and in local/map pack results, you want to be in the top three results for maximum visibility.
If you’re struggling to break into those top ranks, check out our ‘Multi-location SEO magic for SERP nerds’ on-demand webinar. In it, Andrew Shotland from Local SEO Guide shares essential multi-location SEO best practices and innovative ways to use big data to take your search strategy to the next level.
Want to learn more? See our latest in-depth analysis of Google Business Profile trends by vertical, and catch our 2023 Local search ranking factors breakdown webinar on demand now for more insights to fuel your enterprise local marketing strategy.
Related resources

Leading mobility company turns reputation management into a powerful acquisition and revenue driver

evo: Turning reputation into a growth engine
Solotel: Using guest feedback to drive visibility, engagement, and better decisions
Newsletter
Get industry insights that matter, delivered direct to your inbox
We collect this information to send you free content, offers, and product updates. Visit our recently updated privacy policy for details on how we protect and manage your submitted data.